Figures & data
Fig. 1 Summary of outcomes in the PPCOS study, with total of 626 and 750 participants in the PPCOS I and PPCOS II, respectively. The ratios of failure and success are presented over the bars.
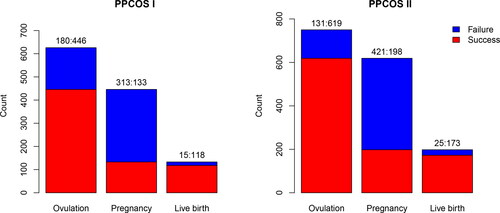
Fig. 2 P-values of the sequential logistic regression for the PPCOS data. The red lines indicate the nominal significance level 0.05 adjusted by the Bonferroni correction.
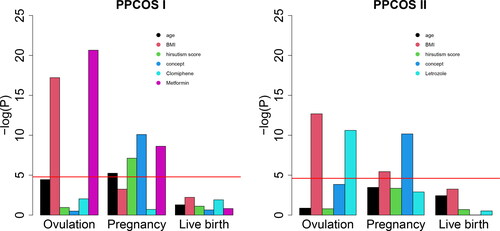
Fig. 3 Possible scenarios for a variable to be selected (colored cells) or not (blank cells) with respect to the three outcomes. The left-hand side presents the four scenarios (no, late, mid, and early influence) when variables selected earlier are kept later. In this case, we do not wish to impose additional penalties on those selected variables. The right hand side presents the other four scenarios (insertion, mid and early termination, interruption) when some variables are selected at some point and dropped at another point later. This is the case that we impose additional penalties.
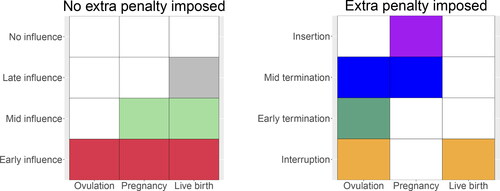
Table 1 Simulation results for variable selection and estimation.
Table 2 Baseline characteristics used as covariates in the regression model.
Fig. 4 Covariates identified by various methods. The red, green, and white blocks represent negative, positive, and no effects on the three binary outcomes, respectively.
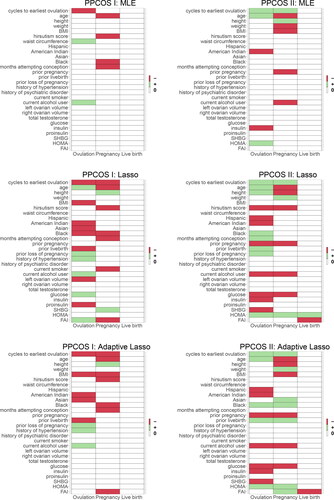
Fig. 5 Covariates identified by various methods (cont.). The red, green, and white blocks represent negative, positive, and no effects on the three binary outcomes, respectively.
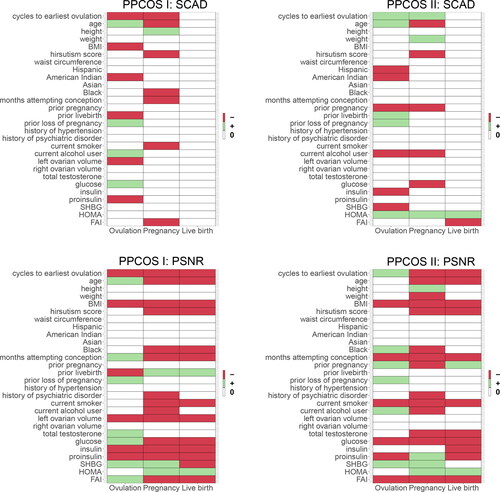
Fig. 6 The barplots show the number of covariates identified by various methods across the three stages. The Venn diagram shows the consensus between the results of the PPCOS I and PPCOS II using the proposed method.
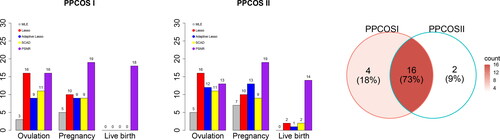
Fig. 7 Receiver operating characteristic (ROC) curves show the predictive performance of the regression models trained on the PPCOS I dataset and applied to the PPCOS II dataset. CM: Clinical model using treatment, age, BMI, hirsutism score, and number of months of attempting conception as covariates.
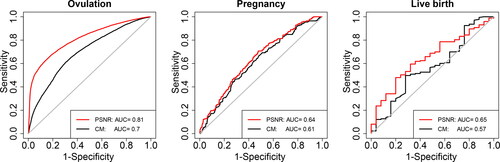
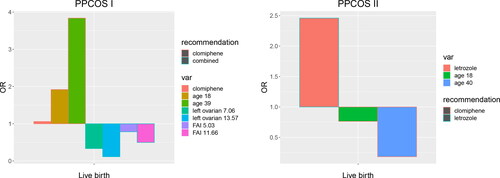
Fig. 8 Odds ratio (OR) of treatment and subgroup effects identified by PSNR. Based on the variables that are identified to interact with the treatment, we dichotomize the patients into subgroups with low and high values of those variables. Treatment recommendations are given according to the ORs. From the PPCOS I, in terms of live birth rate, the main effects of clomiphene and combination therapy are quite close; clomiphene is more effective for older women; combination therapy is more effective for the patients with a larger left ovarian volume or FAI. From the PPCOS II, letrozole is more effective in terms of live birth rate, whereas clomiphene is more effective for older women.