
Figures & data
Fig. 1 Causal diagram for MDP under settings where treatments depend on current states only. represents the state-treatment-outcome triplet. Solid lines represent causal relationships.
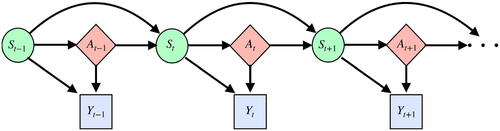
Fig. 2 Empirical rejection probabilities of our test and the two-sample t-test with and of the O’Brien and Fleming sequential test developed by Kharitonov et al. (Citation2015). The left panels depicts the empirical Type-I error and the right panels depicts the empirical power. Settings correspond to alternating-time-interval, adaptive and Markov designs, from top to bottom plots.
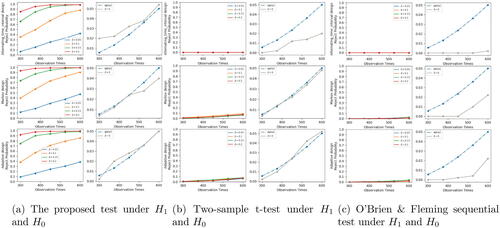
Fig. 3 (a) Empirical rejection probabilities of the proposed test and the test based on V-learning. (b) Empirical rejection probabilities of the proposed test and the test derived based on analysis of crossover trials. The shaded area corresponds to the interval where MCE denotes the Monte Carlo error
.
![Fig. 3 (a) Empirical rejection probabilities of the proposed test and the test based on V-learning. (b) Empirical rejection probabilities of the proposed test and the test derived based on analysis of crossover trials. The shaded area corresponds to the interval [0.05−1.96MCE,0.05+1.96MCE] where MCE denotes the Monte Carlo error 0.05×0.95/500.](/cms/asset/70f4af0c-324c-42f5-a4d1-dc759733ef2d/uasa_a_2027776_f0003_c.jpg)
Fig. 4 Our test statistic (the orange line) and the rejection boundary (the blue line) in the A/A (left plot) and A/B (right plot) experiments.
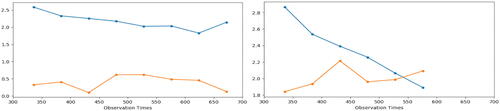
Table 1 Powers of t-test, DML-based test and the proposed test under Examples 1 and 2, with T = 500, .
follow iid Bernoulli distribution with success probability 0.5.