
Figures & data
Table 1 DGP1 with heterogeneous AR(1) idiosyncratic error
Table 2 DGP2 with heterogeneous AR(1) idiosyncratic error
Table 3 DGP3 with heterogeneous AR(1) idiosyncratic error .
Table 4 DGP4 with heterogeneous AR(1) idiosyncratic error .
Fig. 1 The left panel presents the cross-section across N = 151 countries of the p-values for the Augmented Dickey–Fuller test for log GDP, in level (black line) and in first-difference (red line). The blue line indicate the 5% level. The right panel presents the largest eigenvalues of the sample covariance matrix for the panel of log GDP (black line) and for the panel of log investment (red line), normalized by setting the maximum eigenvalue equal to unity.
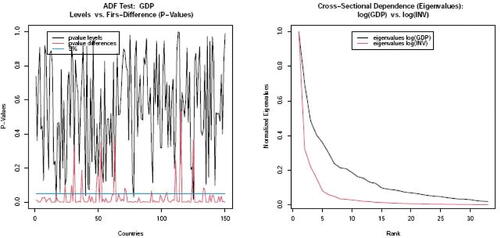
Fig. 2 The top three panels present the estimated cross-sectional density, based on the nonparameteric Kernel estimator, of the growth effect () corresponding to all countries (N = 151—left panel), OECD countries (N = 31—middle panel), and Non-OECD countries (N = 120—right panel), and the bottom three panels present the estimated cross-sectional density, based on the nonparameteric Kernel estimator, of the level effect (
) corresponding to all countries (N = 151—left panel), OECD countries (N = 31—middle panel), and Non-OECD countries (N = 120—right panel).
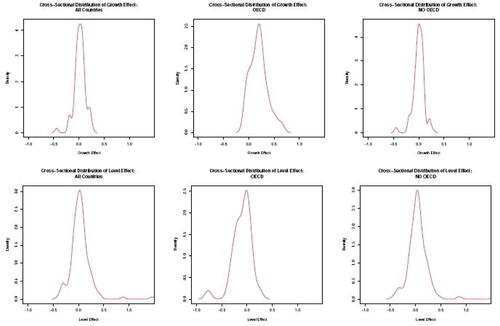
Table 5 Capital accumulation and GDP growth.