
Figures & data
Figure 1: DAGs representing treatment and outcome confounding proxies when exchangeability holds.
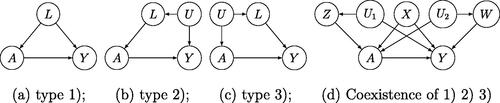
Figure 2: Coexistence of types (1), (2), and (3) proxies when exchangeability fails.
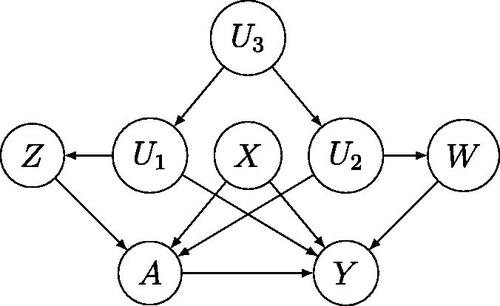
Figure 3: A causal DAG of proximal causal inference.
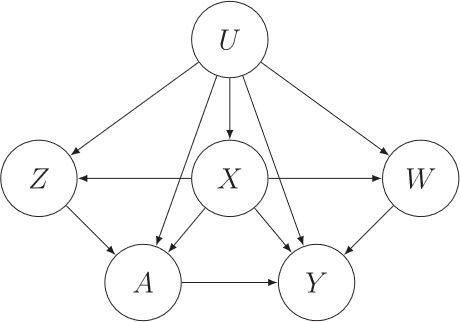
Table 1: Simulation results: absolute bias () and MSE (
).
Table 2: Simulation results: coverage () and average length (
).
Table 3: Treatment effect estimates (standard deviations) and 95% confidence intervals of the average treatment effect.
Supplemental material