Figures & data
Fig. 1 Estimation biases for coefficients β1, β2, and β3 (Panel A), as well as cumulative baseline hazards at times 0.6 and 1.2 (Panel B) over 100 Monte Carlo simulations. and
. The dotted gray line shows the place where bias equals zero.
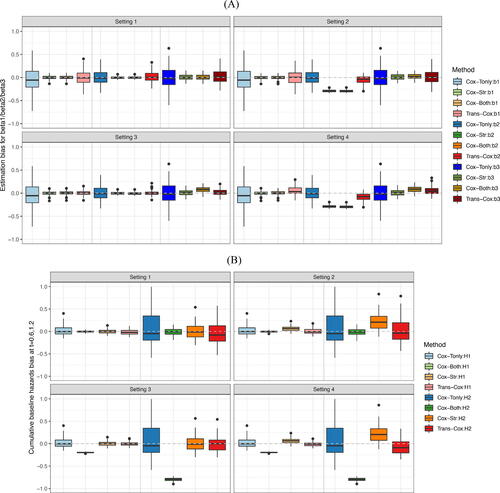
Fig. 2 Boxplots for absolute personalized prediction error of Trans-Cox and other existing methods in different simulation settings at time 0.6 (APPE1) and 1.2 (APPE2). The results are summarized over 100 Monte Carlo datasets.
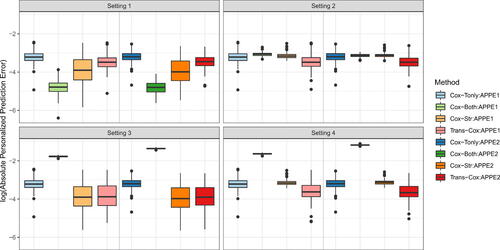
Fig. 3 The estimated cumulative baseline hazard (Panel A) and the survival curves (Panel B) for Trans-Cox (green) and Cox-Both (blue) in comparison to the true curves (red) over 100 Monte Carlo experiments. For survival curves, the covariates are fixed at .
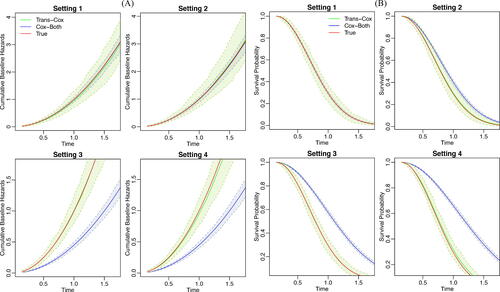
Fig. 4 Summary of the patients’ characteristics of the MDA and NCDB cohorts.
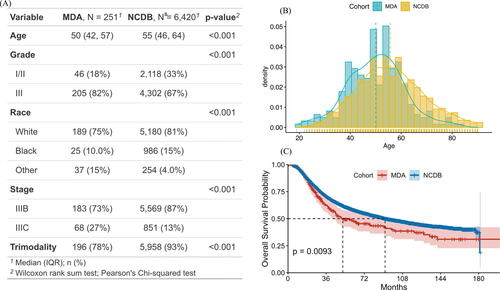
Table 1 Analysis results of the MDA and NCDB cohorts.
Fig. 5 The estimated survival curves using different methods for patients with (left panel) or without (right panel) receiving trimodality treatment. Other characteristics were specified as: age 50 years old, grade III, Black race, and stage IIIC.
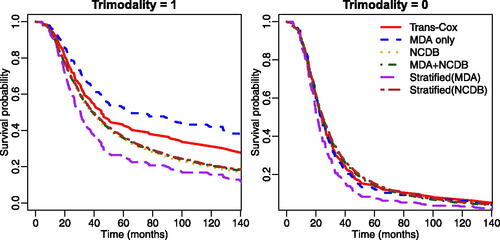
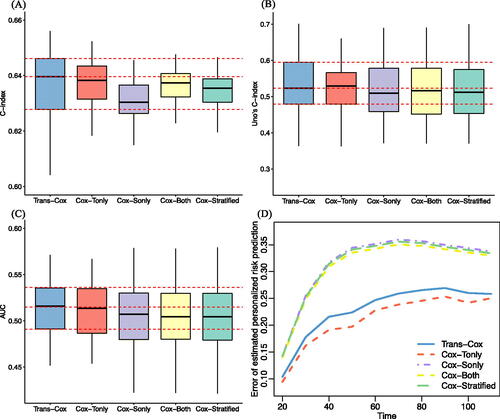
Fig. 6 Evaluation of the prediction performance of four methods using C-index (Panel A), Uno’s C-index (B), AUC (C), and personalized risk prediction error (D).