
Figures & data
Table 1 Time complexity of MCMC steps.
Fig. 1 Boxplot of coverage probabilities among 100 synthetic replicated datasets (a) when K = 3, and the connectivity probabilities pc varies over
; (b) when K = 3,
,
and μ varies over
; (c) when
and K varies over
.
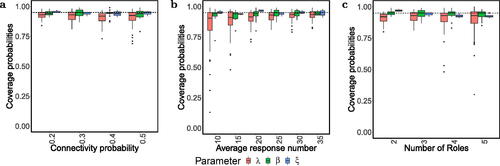
Fig. 2 Running time of 100,000 iterations of the MCMC algorithm on one core of an Intel Xeon Gold 6226R Processor. The number of observations per edge . (a) We fix the connectivity probability
and μ = 25 while varying the number of roles K from 2 to 5. (b) We fix K = 3 and μ = 25 but vary pc from 0.2 to 0.5. (c) We fix K = 3 and
but vary μ from 10 to 35.
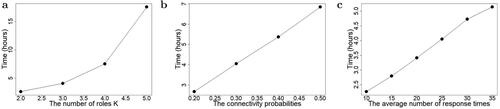
Fig. 3 Patterns learned from the Enron E-mail corpus. (a), (b) The scatterplots of the employee-specific probability of belonging to the first role and the log-scale E-mail numbers (a) when the SMMB is applied to time-to-event data, and (b) when the MMSB is applied to relational data. Each node represents an employee, with the color indicating his or her position. The size of each node represents the number of E-mails related to the employee. (c) The estimated baseline survival curve
of role l replying E-mails to role k when
.
![Fig. 3 Patterns learned from the Enron E-mail corpus. (a), (b) The scatterplots of the employee-specific probability πi1 of belonging to the first role and the log-scale E-mail numbers (a) when the SMMB is applied to time-to-event data, and (b) when the MMSB is applied to relational data. Each node represents an employee, with the color indicating his or her position. The size of each node represents the number of E-mails related to the employee. (c) The estimated baseline survival curve exp {− exp (β̂1lk)[1−S0(t|λ̂lk)]} of role l replying E-mails to role k when x=(1,0,0,…,0)T.](/cms/asset/e928559e-0077-4008-bbea-e3c51d810561/uasa_a_2213466_f0003_c.jpg)
Table 2 The estimated role probabilities by the SMMB from time-to-event data and by the MMSB from binary data of the four CEOs, respectively.
Table 3 The posterior mean, posterior standard deviation (SD), and 95% credible interval (CI) of coefficient ’s for the SMMB learned from the Enron E-mail corpus without considering confidential information.