Figures & data
Fig. 1 Simulations satisfying assumptions. Target for mean row is the mean of true prevalences across datasets. The RMSEs of the test-positive rate and HT-known estimator are identical under simple random testing. The variance of the HT-known estimator is higher than that of the HT-estimated due to occasionally very large weights.
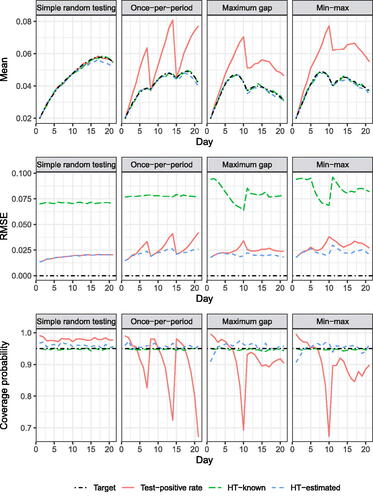
Fig. 2 Daily test counts, including multiple tests per week by the same student. Vertical grid lines correspond to Mondays.
Fig. 3 Daily test counts, including multiple tests per week by the same student. Vertical grid lines correspond to Mondays.
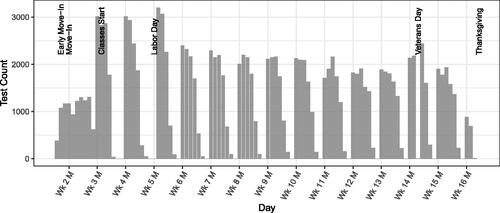
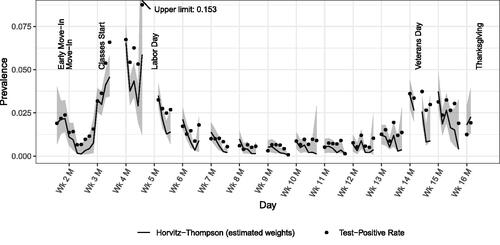
Fig. 4 Daily prevalence estimates, adjusted for test sensitivity and reporting delays. Shaded ribbon is BCa 95% confidence band. No estimates for days with < 100 tests taken. Vertical grid lines correspond to Mondays.