
Figures & data
Fig. 1 The average FDPex rate , FDR and power of the proposed (red) and BH (blue) procedures for testing the hypotheses (2.5) to recover the nonzero treatment effects on the subject level correlations under the block-diagonal signal setting with
, m = 300, n = 100, 200,
and
and 0.3. The nominal level was 0.05.
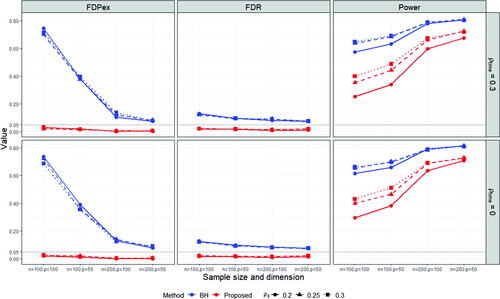
Fig. 2 The average FDPex rate , FDR and power of the proposed (red) and BH (blue) procedures for testing the hypotheses (2.5) to recover the nonzero treatment effects on the subject level correlations under the super-diagonal signal setting with
, m = 300, n = 100, 200,
and
and 0.3. The nominal level was 0.05.
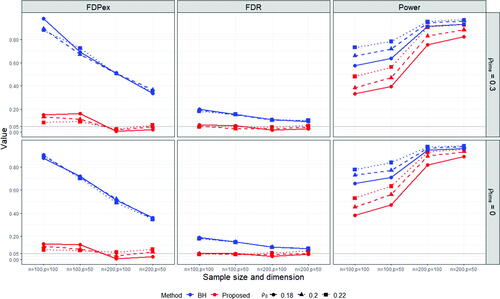
Table 1 The four pairs of ROIs (the functional networks they belong to in the parentheses) with the identified nonzero treatment effects on subject level correlations by the proposed multiple testing procedure, the estimated treatment effect, its 95% confidence interval, and the IPW averages for the treatment group (Ave-trt) and the control group (Ave-cl).