
Figures & data
Fig. 1 RMSE using the pseudo-MLE and the SSE-MLE. From left to right: .
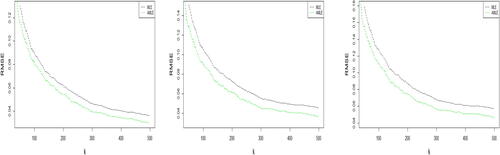
Table 1 Variance reduction for different extreme value indices.
Fig. 2 Variance reduction for various combinations of γ and g.
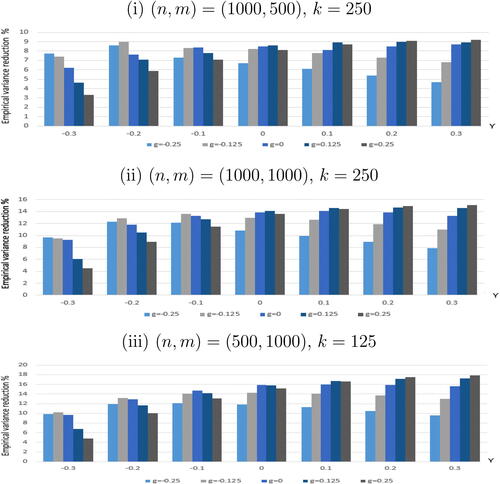
Table 2 Variance reduction for different numbers of unlabeled data m.
Table 3 Variance reduction for the extreme quantile estimator.
Fig. 3 Relative variance reduction for the extreme quantile estimators.
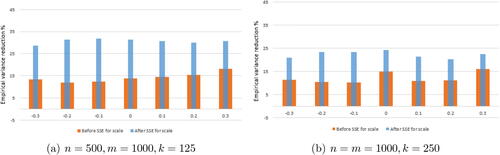
Table 4 Variance reduction with two covariates.
Table 5 Estimation results for three stations.
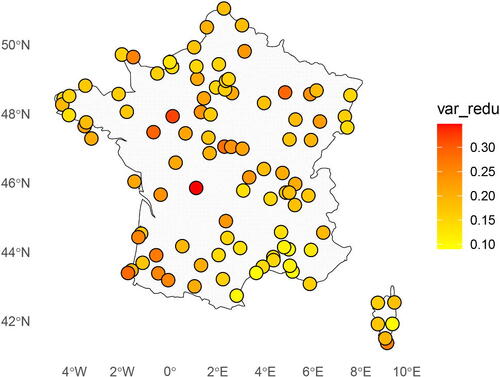
Fig. 4 Heatmap of the variance reduction factor across 100 stations.
Supplemental material