Figures & data
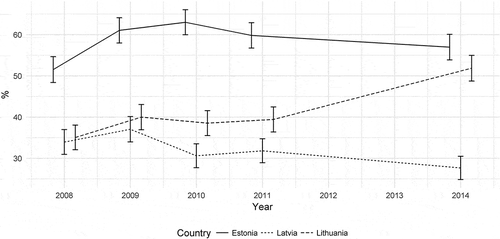
Figure 1. Proportion of respondents who think that the state of healthcare provision in their country is very good or rather good in 2008–14.

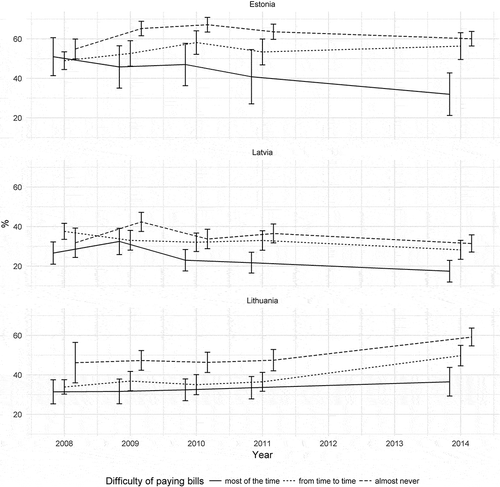
Figure 2. Proportion of people who consider healthcare provision in their country very good or rather good, depending on their economic situation (difficulty paying bills) in 2008–14.

Table 1. Logistic regression models of Estonia for assessment of good or very good healthcare provision in the country (reference bad or very bad).
Table 2. Logistic regression models of Lithuania for assessment of good or very good healthcare provision in the country (reference bad or very bad).
Table 3. Logistic regression models of Latvia for assessment of good or very good healthcare provision in the country (reference bad or very bad).
Table A1. Descriptive statistics of difficulty of paying bills by country and year.
