
Figures & data
Figure 1. Flow diagram of the enrollment, randomization, and retention of participants in the Women’s Flaxseed and Health Study, Toronto, Canada, 2015–2016.
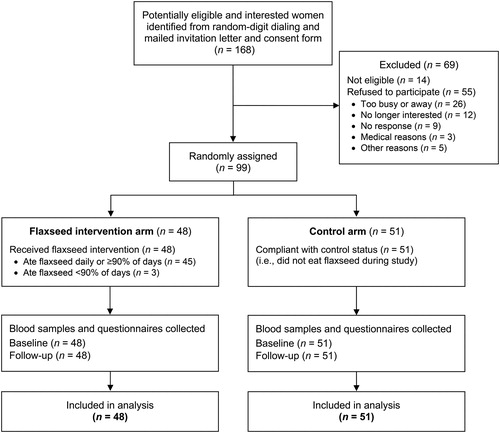
Table 1. Baseline characteristics and serum enterolignan and sex hormone levels of postmenopausal women participants in the Women’s Flaxseed and Health Study, Toronto, Canada, 2015–2016.
Table 2. Changes in serum enterolignan concentrations from baseline to week 7, by study arm.
Table 3. Effect of the dietary flaxseed intervention on changes in serum sex hormone concentrations from baseline to week 7.
Table 4. Spearman correlation coefficients between changes in serum enterolignan concentrations and changes in sex hormone concentrations among women in the intervention arm (n = 48).