
Figures & data
Figure 1. A flow chart depicting the literature search and study selection for the present meta-analysis.
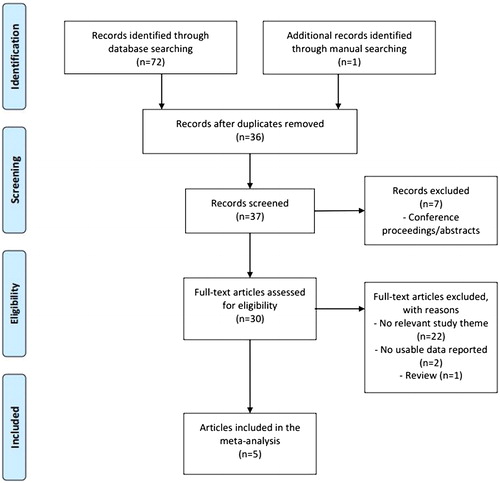
Table 1. Summary of the key characteristics of the studies included in this meta-analysis.
Figure 2. Odds ratios (ORs) and 95% confidence intervals (CIs) from analyzed studies comparing gastrointestinal neoplasms and the TAS2R38 haplotype (AVI vs. PAV) using a fixed effect model. The summarized OR is exhibited using a diamond. The center and both terminals of the diamond indicate the OR and 95% CI, respectively.
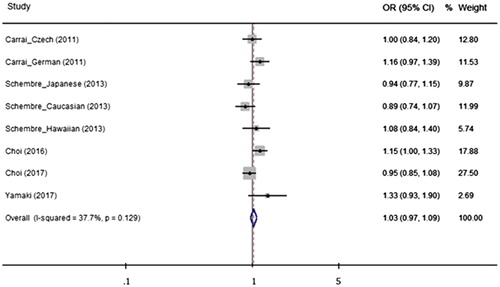
Figure 3. Odds ratios (ORs) and 95% confidence intervals (CIs) from studies comparing gastrointestinal neoplasms and the TAS2R38 diplotype (AVI/PAV vs. PAV/PAV) using a fixed effect model. The summarized OR is exhibited using a diamond. The center and both terminals of the diamond indicate the OR and 95% CI, respectively.
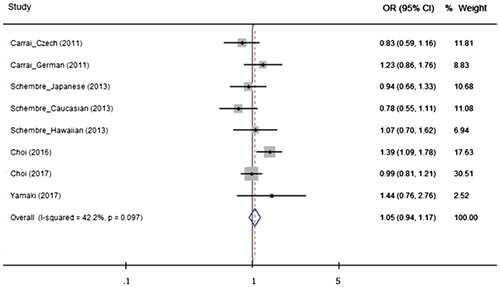
Figure 4. Odds ratios (ORs) and 95% confidence intervals (CIs) from studies comparing gastrointestinal neoplasms and the TAS2R38 diplotype (AVI/* vs. PAV/PAV) using a fixed effect model. The summarized OR is exhibited using a diamond. The center and both terminals of the diamond indicate the OR and 95% CI, respectively
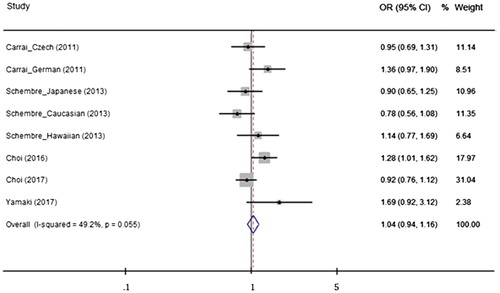
Table 2. Stratified analyses of the effect of the TAS2R38 diplotype (AVI/AVI vs. PAV/PAV or PAV/*) on the risk of gastrointestinal neoplasms.