Figures & data
Figure 1. Patient disposition.
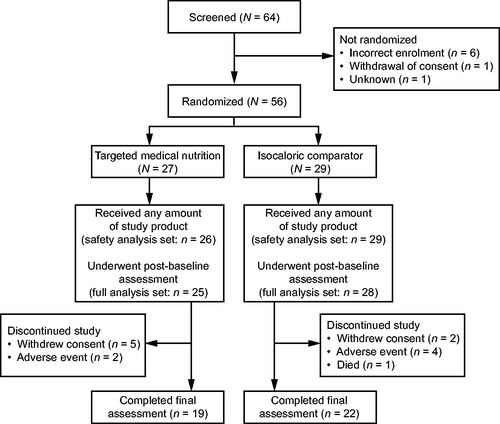
Table 1. Baseline patient demographics and characteristics.
Table 2. Related adverse events and serious adverse events experienced by patients in the TMN and isocaloric comparator groups.
Table 3. Change from baseline to week 12 in vital signs and laboratory safety parameters in the TMN and isocaloric comparator groups.
Figure 2. Change from baseline to week 12 in the TMN group and the isocaloric comparator group in neutrophil:lymphocyte ratio. Data are mean ± SEM for the full analysis set; P value was estimated by analysis of covariance adjusted for baseline value. Mean change from baseline to week 12 was calculated as: week 12 value minus baseline value for each patient, divided by the n number. TMN group, n = 18; comparator group, n = 19. SEM, standard error of the mean; TMN, targeted medical nutrition.
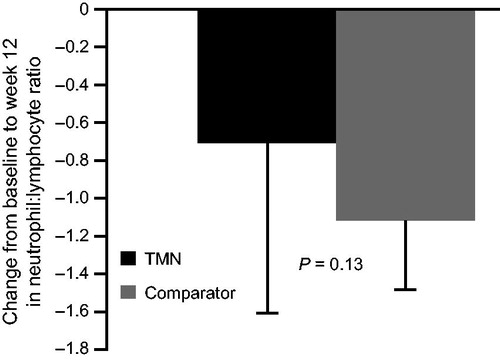
Table 4. Change from baseline to week 12 in secondary efficacy endpoints in the TMN and isocaloric comparator groups.
Figure 3. Change from baseline to week 12 in the TMN group and the isocaloric comparator group in (a) plasma omega-3 to omega-6 ratio, (b) plasma vitamin D3 level, (c) EPA as a proportion of total plasma fatty acids, and (d) DHA as a proportion of total plasma fatty acids. Data are mean ± SEM for the full analysis set; P values were estimated by analysis of covariance adjusted for baseline value. Mean change from baseline to week 12 was calculated as: week 12 value minus baseline value for each patient, divided by the n number. TMN group, n = 16–17; comparator group, n = 22. DHA, docosahexaenoic acid; EPA, eicosapentaenoic acid; SEM, standard error of the mean; TMN, targeted medical nutrition.
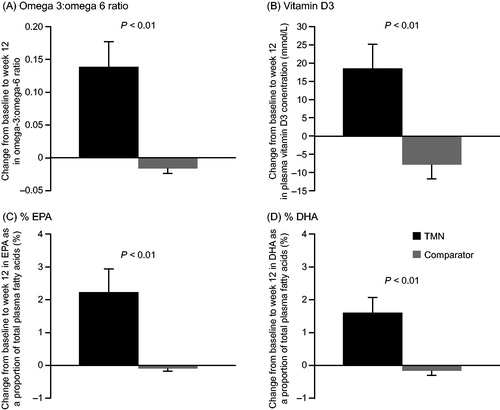
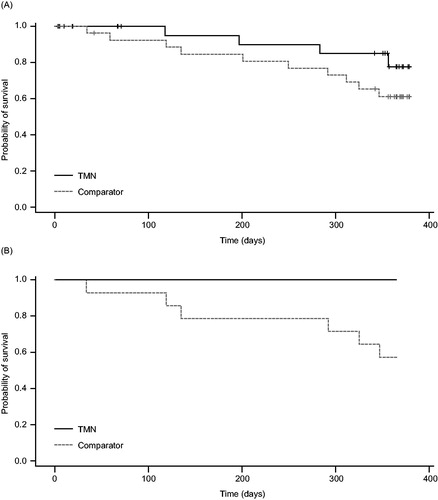
Figure 4. Kaplan–Meier curves showing survival from baseline to 1 year (a) overall and (b) in the subset of patients with pre-cachexia, in the TMN group and the isocaloric comparator group. a) TMN group, n = 25; comparator group, n = 28; P = 0.18. b) TMN group, n = 14; comparator group, n = 14; P = 0.02. TMN, targeted medical nutrition.