Figures & data
Figure 1. The number of surviving mice and changes in tumor size over time in Rag1-/- mice with PC3 tumors treated daily with Bracket fungal extract at 500 or 1,000 mg/kg or control vehicle. Values represent the mean ± SEM. Number of mice = 6–10. For 1,000 mg/kg and 500 mg/kg groups, the number of mice started at 8 due to both having two mice with failed tumor implantation. The number of mice reduced over time due to tumor ulceration (resulting in ethically required euthanasia).
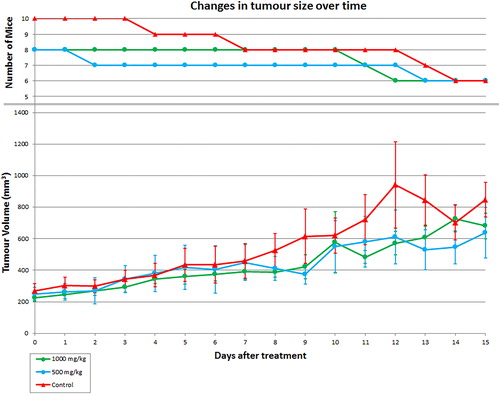
Figure 2. Changes in gene expression levels in Rag1-/- mice treated with F. pinicola extract. A. Changes in human gene expression levels in the PC3 tumors. B. Changes in gene expression levels of mouse genes in the liver tissues. Bars represent the mean and standard error (n = 3). Statistically significant differences vs. controls are shown at *P < 0.05, **P < 0.01.
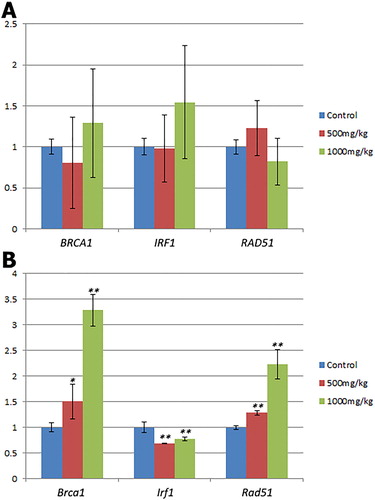
Figure 3. Changes in mouse gene expression levels in CD1 mice treated with F. pinicola extract over time. A. Changes in gene expression levels in the plasma. B. Changes in gene expression levels in the liver tissues. Bars represent the mean and standard error (n = 3). Statistically significant differences vs. baseline are shown at *P < 0.05, **P < 0.01.
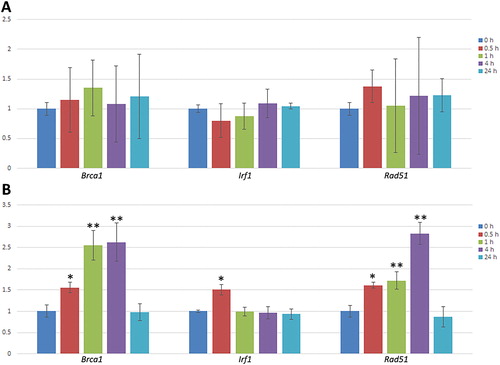
Figure 4. Principal component analysis plot of mouse fecal and plasma samples.
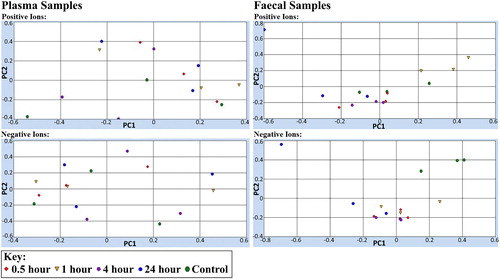
Table 1. Top positive and negative ion intensities in fecal samples of mice treated with F. pinicola extract. Criteria: p-value < 0.0001 in 2 of the 4 time points measured.
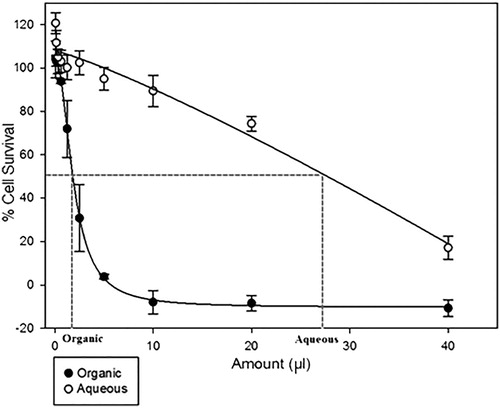
Figure 5. Antiproliferative activity of F. pinicola extract organic fraction and aqueous fraction in PC3 cells using SRB staining method. Symbols represent the mean and standard error of the mean (n = 4 technical replicates).