Figures & data
Figure 1. Flow chart of articles screening.
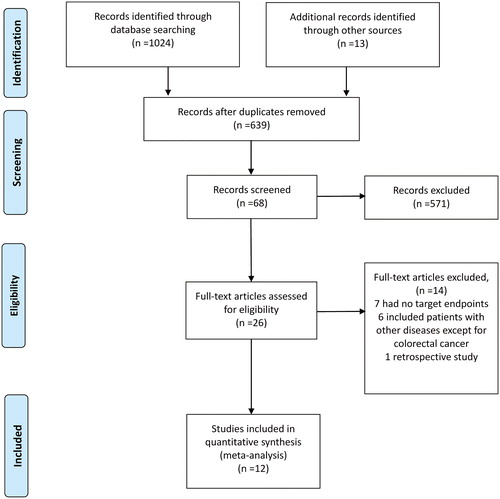
Figure 2. Network of indirect comparisons. The size of the nodes stands for the number of patients included and line width the number of articles comparing each pair of articles.
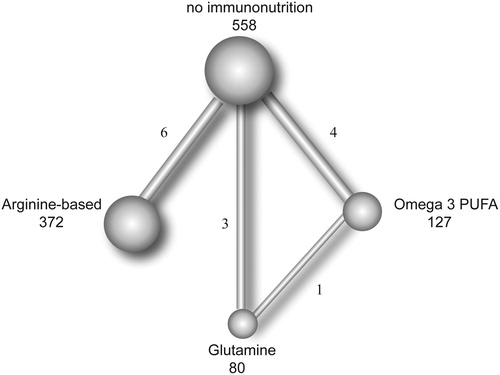
Table 1. Characteristics of the included studies.
Figure 3. Risk of bias graph and risk of bias summary of RCTs.
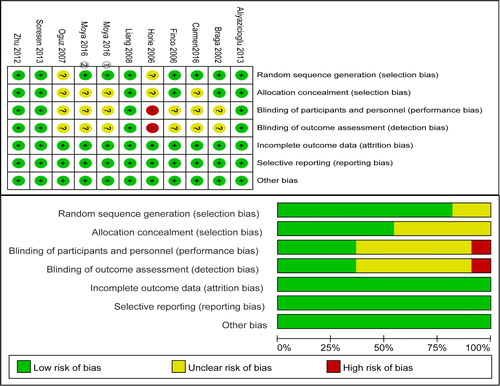
Table 2. Comparison of different immunonutrtion formulas in length of hospital stays between pairwise meta-analysis and network.
Table 3. Comparison of different immunonutrtion formulas in infectious complication between pairwise meta-analysis and network.
Table 4. Comparison of different immunonutrtion formulas in noninfectious complication between pairwise meta-analysis and network.
Table 5. Comparison of different immunonutrtion formulas in Anastomotic leakage between pairwise meta-analysis and network.
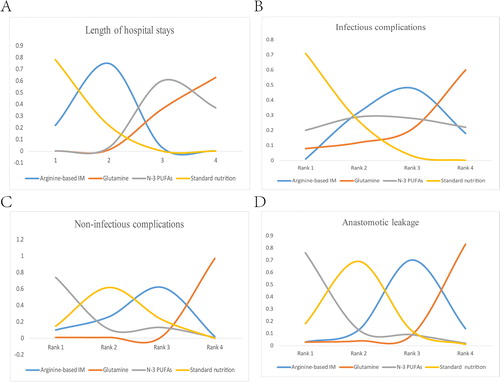
Figure 4. Ranking of outcomes for the included studies. Odds ratio (OR) and 95% confidence interval (CI) were used to expressed the difference between formulas. First rank indicates lowest probability to prevent occurrence of infectious, noninfectious and anastomotic leak complications. For length of hospitalization, first rank indicates longest stay in hospital.