
Figures & data
Figure 1. Diagram depicting the research cohort screening process.
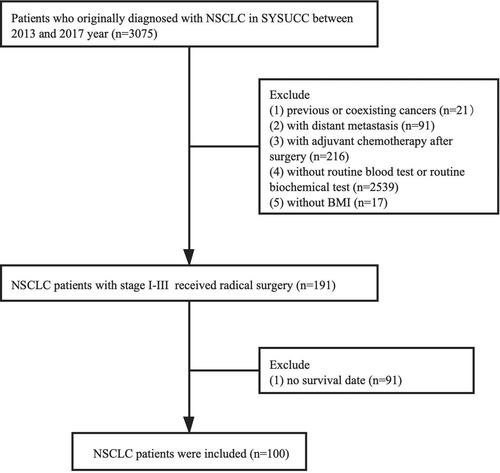
Table 1. Characteristics of all patients.
Table 2. The alterations of nutrition indexes in all patients.
Figure 2. X-Tile analysis of the total risk score and survival according to the optimal cutoff levels of TP (A–C), ALB (D–F), and GLOB (G–I), AGR (J–L).
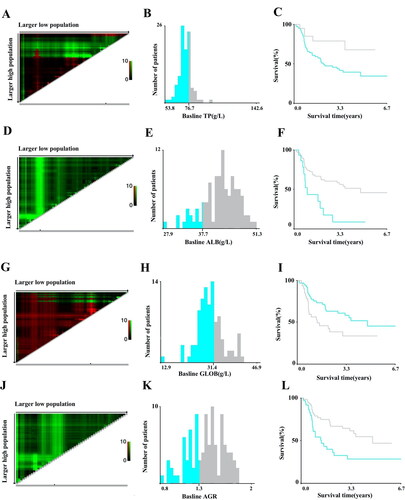
Figure 3. Survival curves according to the cutoff levels of baseline TP, ALB, GLOB, and AGR determined by X-Tile, and survival curves according to fluctuations in HCT and MCV levels. (A) Significant difference in DFS between patients with baseline TP higher than 76.66 g/L and those with TP lower than 76.66 g/L (75% vs. 50%, P = .027). (B) Significant difference in DFS between patients with baseline ALB higher than 37.7 g/L and those with ALB lower than 37.7 g/L (60% vs. 26.7%, P = .002). (C) Significant difference in DFS between patients with baseline GLOB higher than 31.42 g/L and those with GLOB lower than 31.42 g/L (62.7% vs. 39.4%, P = .037). (D) Significant difference in DFS between patients with baseline AGR higher than 1.31 and those with AGR lower than 1.31 (63.5% vs. 40.5%, P = .006). (E) Significant difference in DFS between patients with HCT elevation and those with HCT reduction after surgery compared to the baseline (69.8% vs. 43.9%, P = .013). (F) Significant difference in DFS between patients with MCV elevation and those with MCV reduction after surgery compared to the baseline (73.2% vs. 42.4%, P = .014).
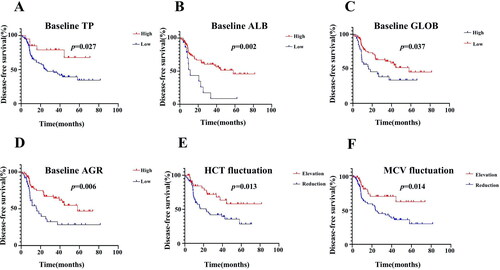
Table 3. The baseline nutrition-related indications for DFS.
Table 4. The nutrition-related indications alterations for DFS.
Table 5. Predictive factors for DFS by univariate and multivariate analysis.