
Figures & data
Figure 1. Study flow chart of inclusion and exclusion criteria. BSC, best supportive care; PS, performance status.
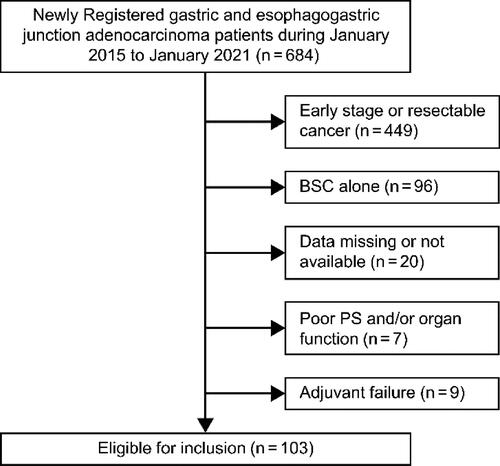
Table 1. Patient characteristics.
Figure 2. Kaplan–Meier survival curves for overall survival and time to treatment failure for the entire cohort (A), Glasgow prognostic score 0 cohort (B), and Glasgow prognostic score 1 and 2 cohort (C). NS, nutritional support; OS, overall survival; RC, routine care; TTF, time to treatment failure.
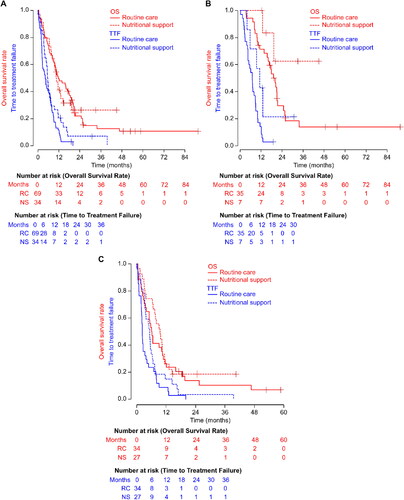
Table 2. Univariate and multivariate analyses of factors associated with TTF and OS.
Table 3. Adverse events.
Supplemental material
Supplemental Material
Download MS Word (23.5 KB)Supplemental Material
Download MS Word (25.5 KB)Data Availability Statement
The datasets generated during and/or analyzed during the current study are available from the corresponding author on reasonable request.