
Figures & data
Figure 1. Overview of the study design.
First, we reviewed and obtained publicly available summary statistics from six GWAS sources of predominantly European ancestry. Second, we selected instrumental variables (IVs) for each exposure (i.e., dietary intakes or medication uses) and mediator (i.e., circulating metabolites, circulating proteins, and gut microbiota). Third, we performed a univariable MR analysis to estimate population-specific causal effects of each exposure (i.e., dietary intakes or medication uses) and mediator (i.e., circulating metabolites, circulating proteins, and gut microbiota) on bladder cancer risk using four established methods. Fourthly, we investigated the mediation effects of each identified circulating metabolite, circulating protein or gut microbe involved in the relation between identified dietary intakes/medication uses and bladder cancer risk. Finally, we assessed the combined effects of diet-medication pairs on bladder cancer risk by using multivariable MR.
Abbreviations: GWAS: genome-wide association study; SNP: single-nucleotide polymorphism; IV: instrumental variable; LD: linkage disequilibrium; MR: Mendelian randomization; MR-PRESSO: MR pleiotropy residual sum and outlier.
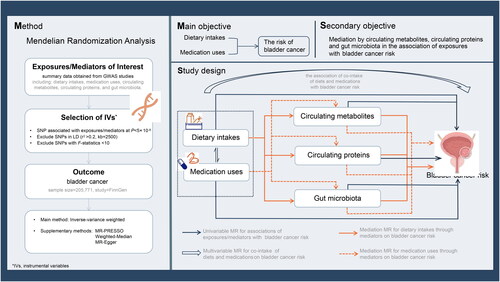
Figure 2. Characteristics of included SNPs.
A, Nightingale Rose Charts showing the instrumental variables. Each segment on this chart represents an exposure or mediator (i.e., dietary intakes, medication uses, circulating metabolites, circulating proteins, and gut microbiota). The lightest purple rings (outer ring) represent the original number of traits in the included GWASs. The medium purple ring (middle ring) represents the number of traits with one or more than one SNPs reporting in GWASs reaching 5 × 10⁻⁸ and can be found in the outcome (BC) datasets. The darkest purple ring (inner ring) represents the number of traits with IVs not less than five SNPs among those selected in the last step; B, distribution of explained variance that the selected genetic variants contributed to the corresponding traits. The horizontal coordinate represents the position of the SNP, the vertical coordinate indicates the -log10 of the variance of the SNP. The dashed line represents a variance of 0.05 for SNP. Different colors indicate SNPs from different exposures and mediators: i.e., blue color represents dietary intakes; yellow color represents medication uses; purple color represents gut microbiota; green color represents circulating metabolites; pink color represents circulating proteins; C, the overall results obtained by different MR approaches. The arrows indicate the MR analysis from exposures (or via the mediators) to the outcome (BC). The numbers upon the arrows indicate the number of statistically significant associations suggested by IVW. The dashed boxes represent co-intake and interaction of dietary intakes and medication uses.
Abbreviations: MR: Mendelian randomization; BC: bladder cancer; GWAS: genome-wide association studies; SNP: single nucleotide polymorphism; IV: instrumental variants; IVW: inverse variance weighted.
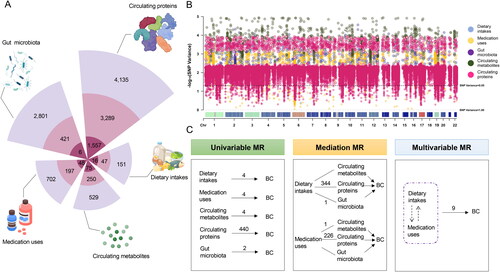
Figure 3. Associations of univariable and mediation MR.
A, forest plot showing univariable MR analyses of dietary intakes, medication uses, circulating metabolites, and gut microbiota on BC risk. The odds ratios (ORs) were shown by solid square and horizontal lines representing the 95% confidence intervals (CIs). Colors are used to distinguish between different exposures: i.e., green color represents dietary intakes; blue color represents medication uses; orange color represents gut microbiota; red color represents circulating metabolites; B, lollipop plot for associations between circulating proteins and bladder cancer risk. The 440 associations suggested to be statistically significant by IVW between circulating proteins and BC are shown on the graph. Each line with a solid circle indicates the beta effect of the association. Blue lines indicate positive beta effect, while purple lines indicate negative beta effect; C, heatmap of identified associations for exposures through identified mediators on bladder cancer risk. Columns represent exposures, rows represent mediators, and the outcome is BC. Exposures were indicated by two colors, i.e., green for medication uses, and orange for dietary intakes. Mediators were indicated by three colors, i.e., purple for gut microbiota, pink for circulating metabolites, and green for circulating proteins.
Abbreviations: No.SNP: number of single-nucleotide polymorphism; OR: odds ratio; CI: confidence Interval; fdr: false discovery rate; IVW: inverse variance weighted; BC, bladder cancer.
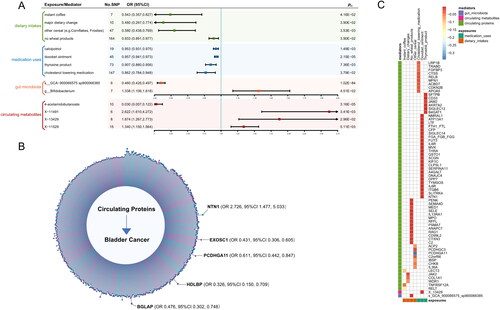
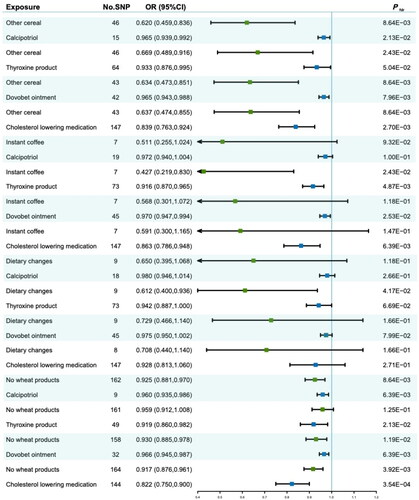
Figure 4. Forest plot for multivariable MR of identified diet-medication pairs and bladder cancer risk.
Square dots denote the odds ratios (ORs); horizontal lines represent the 95% confidence intervals (CIs); Green squares indicate dietary intakes, while blue squares indicate medication uses. A light green color, along with the white color was used to distinguish each diet-medication pair.
Abbreviations: No.SNP: number of single-nucleotide polymorphism; OR: odds ratios; CI: confidence Interval; fdr: false discovery rate.
Supplemental Material
Download PDF (127.5 KB)Data Availability Statement
This work has been conducted using multiple publicly available resources. The data that support the current study and findings could be accessed according to each resource’s guideline. Further information is available from the corresponding author upon request. Analysis code is available via: https://github.com/TeamEYu/MR-of-bc. Supplementary materials with detailed data and additional information are available online. To access these files, please visit https://doi.org/10.6084/m9.figshare.24745152.