
Figures & data
Table 1. Information of clinical characteristics for study cohort.
Figure 1. Multivariate statistical analysis of differential lipid features between ESCC and HC groups using PCA and OPLS-DA models. (A) Pie chart of lipid categories and counts. GP: glycerophospholipid; SP: sphingolipid; FA: fatty acid; GL: glycerolipid. (B) The PCA analysis of all subjects and quality controls. (C) The score plot of OPLS-DA model for ESCC and HC groups. (D) The Overftting test (200 times) for the OPLS-DA model.
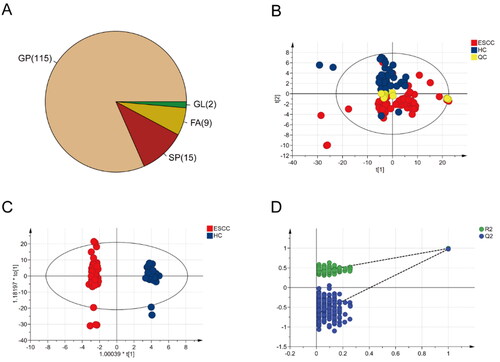
Figure 2. Screening and identification of lipid species by lipidomics analysis. (A) Venn diagram of VIP (variable importance in projection), FDR (false discovery rate) and FC (fold change). (B) Volcano plot of lipid species with adjusted p value and fold change. (C) Heat map of the selected lipid species between ESCC and HC groups. Level distribution of differential lipids between ESCC and HC groups. Clustering heat map was draw using R software by data transforming with log10. The majority of differential lipids in the ESCC group showed a tendency of significant decrease compared to HC group.
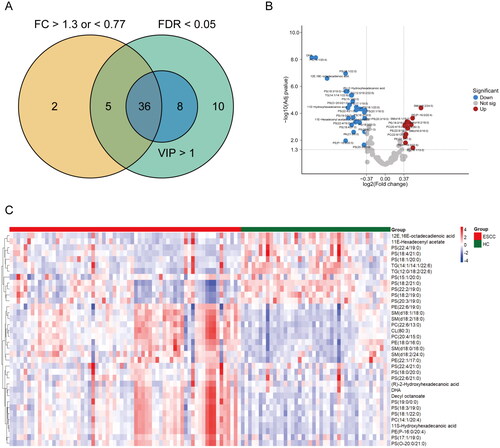
Table 2. Identification and selection of 36 differential lipids.
Figure 3. (A-G) ROC curves for the top 7 differential lipids of highest diagnostic value. PC: phosphatidylcholine; PS: phosphatidylserine. (H) ROC curve for the combination diagnostic model of seven lipids. AUC: Area Under Curve. CI: Confidence Interval.
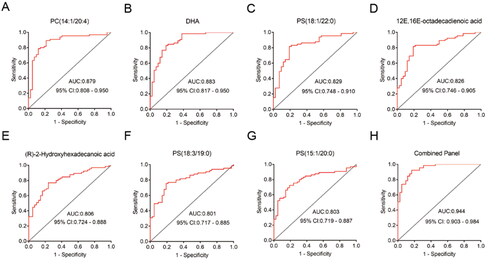
Figure 4. Box plots of the relative abundance of the 7 lipids with highest AUC value between ESCC (TNM I&II, III&IV) and HC groups. The levels of differential lipids were displayed with mean ± SEM. *: p < .05; **: p < .01; ***: p < .001; NS: no significance. PC: phosphatidylcholine; PS: phosphatidylserine.
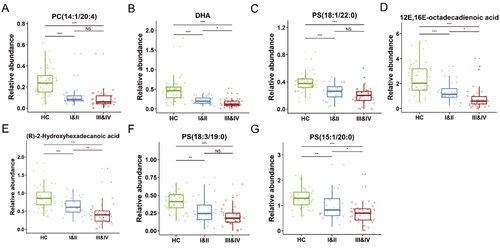
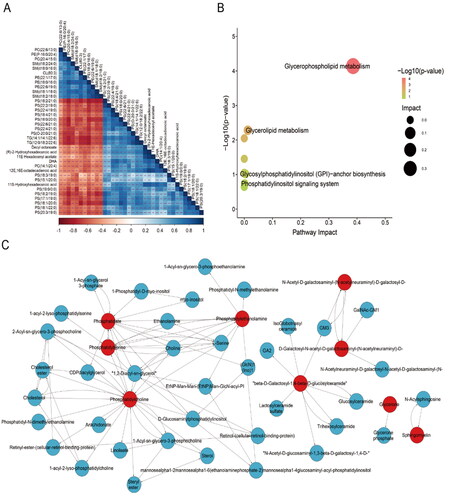
Figure 5. Correlation and metabolic pathway analysis. (A) Heat map of the correlation strength of the lipids. **: p < .01; ***: p < .001. (B) The pathway impact plot of 36 differential lipids. (C) Network of differential lipids metabolic pathways, the red-labeled represented the differential lipids, while the metabolites associated with the differential lipids were marked in blue.
Data availability statement
The analyzed data sets generated during the study are available from the corresponding author on reasonable request.