Figures & data
Table 1 Descriptive Information and Statistics for the Stimulus Stories in the Combined Data Set
Figure 1. Preprocessing steps for the eye-tracking data. Note. Study 1 = Van den Hoven et al. Citation2016. Study 2 = Mak and Willems Citation2018. Study 3 = Eekhof et al. Citation2018
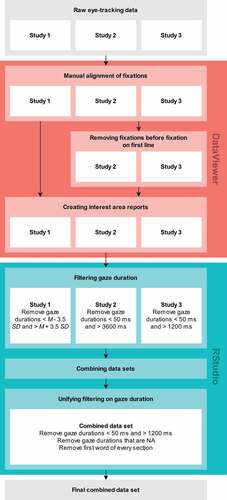
Table 2. Descriptive Statistics for the Eye-Tracking Data Set
Table 3. Descriptive Statistics for the Word Characteristics of the Whole Data Set (Left) and Unique Words (Right)
Table 4. Coefficients for the Final Model Predicting Gaze Duration by Word Characteristics Using Content and Function Words (Left) or Content Words Only (Right)
Figure 2. Violin plots and box plots for the coefficients of the random slopes of relationships of word characteristics with gaze duration. Note. Word characteristics were scaled and centered for analyses. Dots denote values more than 1.5 times the interquartile range away from the upper or lower quartile
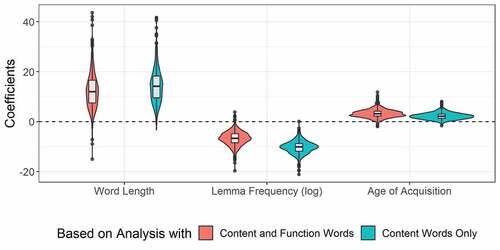
Table 5. Coefficients for the Models Predicting Sensitivity to Word Characteristics Based on Content and Function Words (Left) or Content Words Only (Right) by SWAS and ART Scores and Liking and ART Scores
Figure 3. Scatterplots of the relationships between the coefficients of the random slopes of the relationships between gaze duration and word length, gaze duration and lemma frequency, gaze duration and age of acquisition, and ART scores. Note. Word characteristics were scaled and centered for analyses. ART scores were scaled and centered for analyses but are presented on their original scale here for interpretability. Gray shading denotes 95% confidence intervals
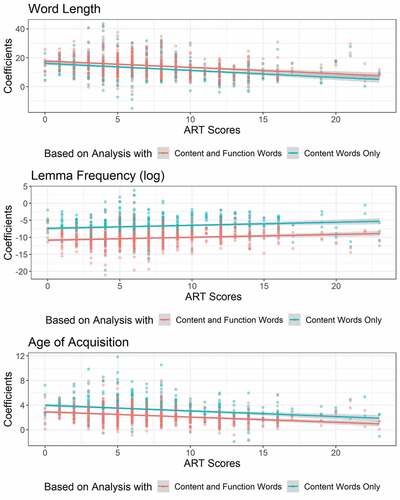
Figure 4. Scatterplot of the relationship between the coefficients of the random slopes of the relationships between gaze duration and word length and SWAS scores. Note. Word characteristics were scaled and centered for analyses. SWAS scores were scaled and centered for analyses but are presented on their original scale here for interpretability. Gray shading denotes 95% confidence intervals
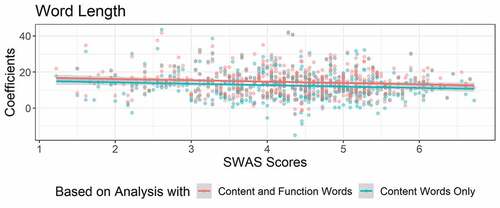
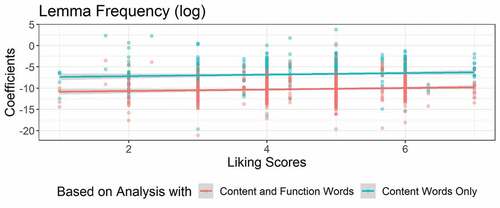
Figure 5. Scatterplot of the relationship between the coefficients of the random slopes of the relationships between gaze duration and lemma frequency and liking scores. Note. Word characteristics were scaled and centered for analyses. Liking scores were scaled and centered for analyses but are presented on their original scale here for interpretability. Gray shading denotes 95% confidence intervals