
Figures & data
Table 1. Comprehension score per connective, including transparency and frequency per million words. Mean: average transformed coherence judgment score per connective.
Table 2. Descriptive statistics for the included tests. Kurt.: kurtosis; Rel.: Spearman-Brown corrected split-half reliability; α: Cronbach’s alpha.
Table 3. Pearson’s correlations for individual difference measures and the connective comprehension score, corrected for multiple comparisons. *Correlation significant at the p < .01 level.
Table 4. Regression coefficients and test statistics from the full and final ordinal mixed-effects model.
Figure 1. Effect display for the interaction effects between condition and lexical transparency (left) and condition and CRT (right) in the final model.
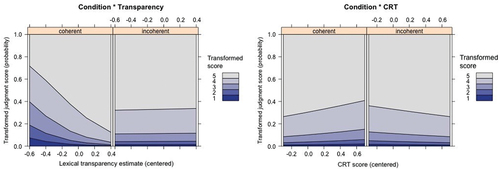
Figure 1A. Presents a distribution of the lexical transparency ratings per connective.
Data availability statement
All materials, data and code are available in an online repository at https://osf.io/85a3e/.