Figures & data
Figure 1. Experimental stimulus example. The picture can be described as (e.g.) the policeman is kicking the clown or the clown is being kicked by the policeman.
Table 1. Absolute observed frequencies of producing a passive voice description by levels of perceptual cue (on the agent or on the patient) and lexical prime (matching the agent or the patient) .
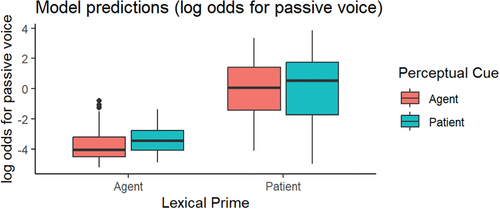
Figure 2. Box plot of the predicted values from the binary logistic mixed effects model, broken down by perceptual cue (red for agent, blue for patient) and lexical prime (x-axis labels). Predicted values are in log odds units.