
Figures & data
Figure 1. Study design.
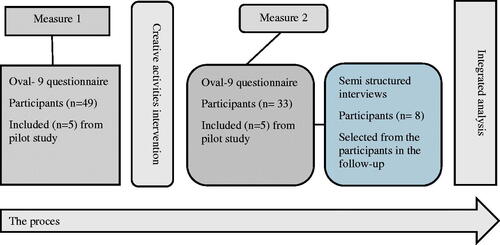
Table 1. Characteristics of the Participants in M2
Figure 2. Percentage distribution of occupational values (measure 1 and measure 2). (a) Measure 1. (b) Measure 2. The figure displays the percentage distribution of the experiences from 1 to 7 of the responses to the nine items of OVAL-9. Light blue = 1 (a low degree), orange = 2, grey = 3, yellow = 4, blue = 5, green = 6, dark blue = 7 (a high degree). Note that not all the response categories were used for some items. This is indicated with the value of 0 between adjacent categories.
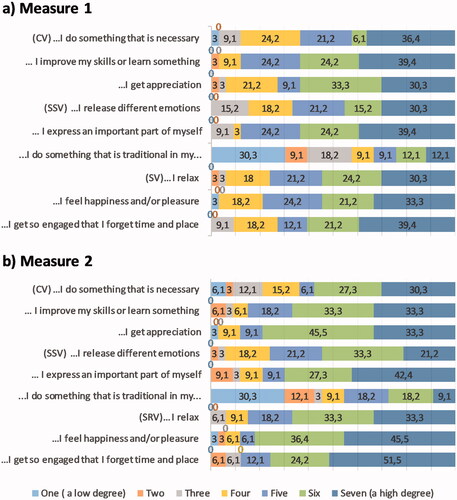
Table 2. Sub-Categories and Categories of Experiences of Occupational Value of CaI According to the Occupational Value Triad