Figures & data
Figure 1. Association between bulk milk somatic cell count and prevalence of cows with somatic cell count (SCC) > 200,000 cells/ml (Barkema, H.W., unpublished data from 300 Dutch dairy farms).
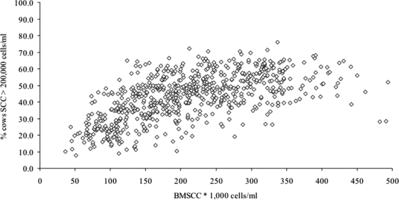
Figure 2. Scatterplot of linear score (LS) versus linear score of the previous milk test (PLS) (adapted from DairyComp 305 output; ▴ = 1st parity, • = 2nd parity, ▄ = parity >2; PLS=0 indicates that they were not lactating at the previous milk test).
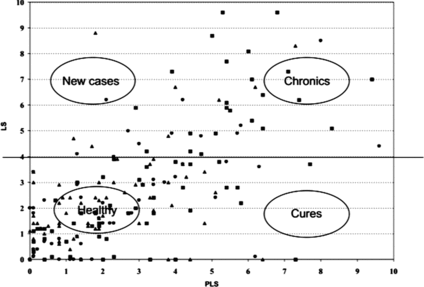
Table 1. Tables to determine whether an increase of bulk milk somatic cell count (cells/ml) should prompt intervention (Lam et al. Citation1998)a.
Figure 3. New infections at the 1st milk test in heifers (red) and older animals (yellow) (adapted DairyComp 305 output; ▴ = 1st parity, • = 2nd parity, ▄ = parity >2; LS= linear score, PLS = previous LS; PLS=0 indicates that the heifers were not lactating at the previous milk test).
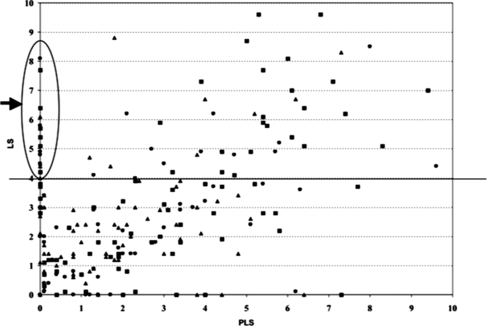
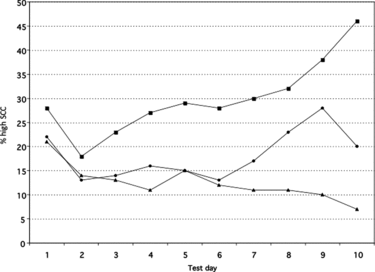
Figure 4. Example of a herd with an increasing prevalence of high SCC with increasing parity and increasing days in milk (adapted from DairyComp 305 output; ▴ = 1st parity, • = 2nd parity, ▄ = parity >2; high SCC = SCC > 200,000 cells/ml).