Figures & data
Table 1. Patient details.
Figure 1. AEEG equipment. (a) Shaved forehead, (b) electrodes glued on with collodium, (c) electrode stickers placed on the forehead and (d) on the temporal bone and (e) recording box underneath the metal protection bar. The cables are braided through the manes and loosely connected to the box to enable free movement of head and neck without pulling on the cables.
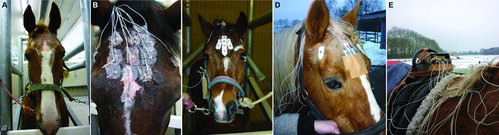
Table 2. Compositions used in the controls and patients.
Figure 2. Normal beta wave brain activity in a control horse showing the channels indicating the location of the electrodes. The electrical activity recorded on each electrode was compared to the indifferent one. Electrical difference between electrode sets are graphically visualised on the computer screen. F = frontal, C = central, P = parietal and T = temporal. The electrodes on the left side of the horse's head are odd numbered, on the right side even numbered and those on the midline are named ‘z’. Scale: 50 μV/division and 1 second/division.
Figure 3. Electrode position based on MRI scan. (a, b) The electrodes are named as follows: F = frontal, C = central, P = parietal and T = temporal. The electrodes on the left side of the horse's head are odd numbered, on the right side even numbered and those on the midline are named ‘z’. The distance between the horizontal electrode rows on the forehead is 25% of the total length. Electrodes F3 and F4 are placed just inside the edges of the location of the brain. (c) Longitudinal view indicating that the capsule (white spot) placed on the processus zygomaticus of the os temporalis was not projected above the cerebrum. (d) Capsule placement on the crista frontalis of the os temporalis projected above the cerebrum.
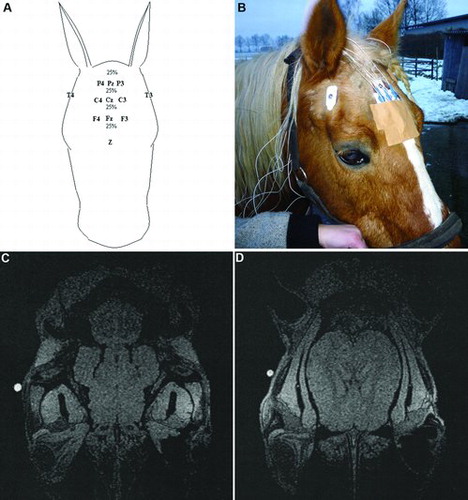
Figure 4. EEG recording during drowsiness or sleep in a horse. (a) Theta waves (indicated between → and ←) seen during a period of drowsiness: irregular waves of 5–6 Hz and amplitude 10–40 μV. The waves occurred for a period of approximately 7 seconds. Scale: amplitude 50 μV/division and 1 second/division. (b) Sleep spindles indicated by * are seen as single waves of 10–12 Hz with an amplitude of 30–60 μV. Scale: amplitude 50 μV/division and 1 second/division.
Figure 5. Normal rhythmical EEG recordings of a horse. (a) Masking EMG artefacts while chewing in an eating normal horse. Scale: 200 μV/division and 1 second/division. (b) The waves marked with * are eye movements and the smaller waves marked with ← are the result of blinking the eyelid. Scale: amplitude 50 μV/cm and 10 seconds/division.
Figure 6. EEG recordings showing pathological activity in horses. (a) Generalised spike burst activity of 4–5 Hz and <520 μV amplitude indicative of interictal epileptiform activity in a patient with clinical epilepsy (patient 7). Scale: amplitude 200 μV/division and 1 second/division. (b) Intermittent rhythmical delta activity of 3–4 Hz (duration 3 seconds) followed by generalised large irregular and uncoordinated activity (patient 10). Scale: amplitude 50 μV/cm and 1 second/division. (c) Spikes located on F4-T4, C4-T4, P4-T4 and Tz-Pz (patient 3) identified as sharp waves (amplitude 20–120 μV and duration 80 ms). Scale: amplitude 50 μV, 1 second/division. (d) Generalised high-voltage rhythmical spike discharge (patient 9) (amplitude 600–800 μV and frequency 3–4 Hz lasting 31 seconds with chaotic extinction). Scale: amplitude 200 μV/division and 1 second/division. (e) Intermittent generalised rhythmical slow delta waves of 1 Hz (amplitude of 20–100 μV and 14 seconds duration with chaotic extinction) (patient 10). Scale: amplitude 50 μV/division and 10 seconds/division.
Figure 7. EEG showing generalised slow delta waves. MRI showed a left-sided space-occupying mass identified as an abscess. (a) Generalised rhythmical slow delta waves (1 Hz and amplitude of 20–100 μV) (between arrows) suggestive of an intracranial space-occupying mass (patient 5). Scale: amplitude 50 μV/division and 1 second/division. (b) B1 – space-occupying mass indicative of abscess (grey circle on the upper right part of the figure) in the dorsal view of the left hemisphere of the cerebrum; B2 – caudal view; B3 – expansion of the mass between the eyes in the caudal view.