
Figures & data
Table 1. Distribution of mce genes within the order Actinomycetales.
Table 2. List of MAP cell surface proteins and their functions.
Figure 1. Schematic diagram of M. tuberculosis mce operons. Transcription regulators are colored in brown, yrbE genes in blue, mce genes in green, mas genes in yellow and genes encoding Mce-family lipoprotein (lpr) are shown in purple.
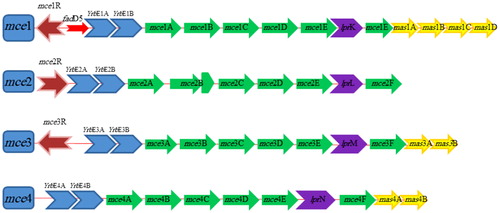
Table 3. Classification of MAP and MTB H37Rv yrbE and mce genes.