
Figures & data
Table 1. Dogs were assigned to 1 of 4 disease status groups based on the combined criteria outlined for pruritic behaviour, owner assessed pruritus score (PVAS), Favrot’s criteria set 2, CADESI-04 score and relevant history and physical examination findings.
Table 2. Dogs included in the study with their signalment and assignment to disease status group.
Figure 1. Relative abundance (mol %) of the positively identified skin lipids found on the skin of 39 WHWT dogs.
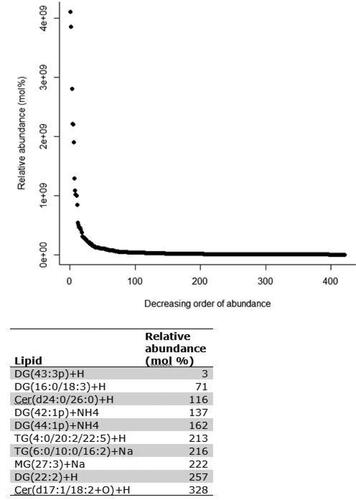
Figure 2. Principal component analysis (PCA) comparing feature profiles of dogs in all disease categories. Both unaffected and affected samples are included in the analysis. Legend describes the disease status groups: AD = atopic dermatitis, LAD = likely atopic dermatitis, ONA = other skin disease, non-atopic, HNA = apparently healthy, non-atopic.
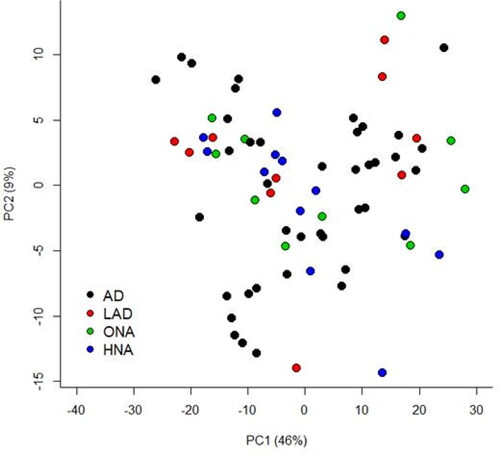
Figure 3. PCA of lipid profiles from Affected and Unaffected sites from all dogs that had paired samples collected. Not represented in this plot are 6 dogs that did not have a paired sample collected (4 HNA dogs and 2 ONA dogs).
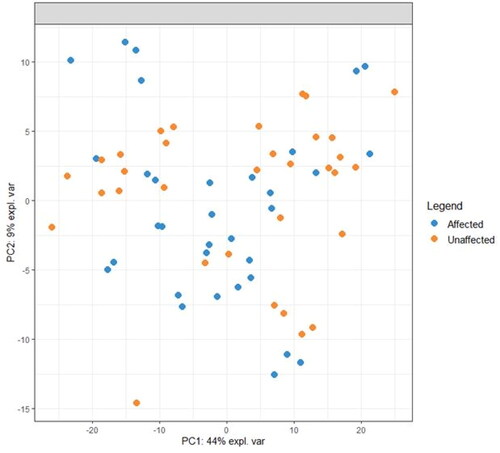
Figure 4. A reduced-space plot of the discriminant axes showing a clear distinction between samples from affected and unaffected sites.
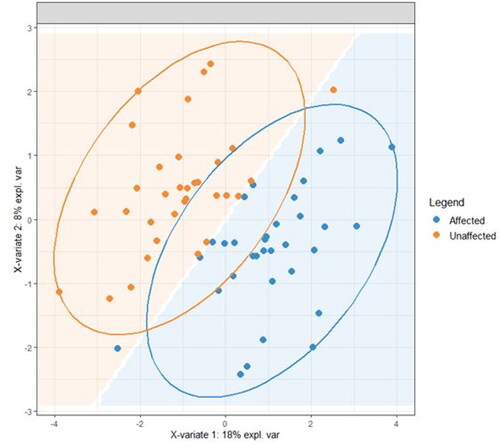
Figure 5. Association network plots for the (a) First component and (b) Second component depict the lipids most likely to be associated with a site being affected or unaffected (A = affected, UA = unaffected). (a) In the first component, positive values are associated with a site likely to be affected so a site high in the lipids shown is likely to be unaffected. Lipid X267 is positively associated with a site being unaffected and is negatively associated with a site being affected. The same is true to a lesser degree for all the lipids shown, with the relationship being weakest for X22. (b) In the second component, positive values were associated with a site likely to be unaffected, therefore sites high in those lipids are more likely to be affected. X48 is positively associated with a site being affected and negatively associated with a site bring unaffected. Lipid X382 is also associated with being affected, but the relationship is weaker.
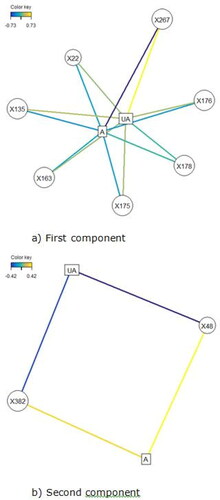
Table 3. Positively identified lipids and partially identified lipids present in the skin samples from the 39 dogs with LC-MS using the lipid databases LipidBlast and LipidSearch.
Data availability statement
All data generated or analysed during this study are included in this published article and the Additional and supporting information files and full lipid data set is available on the Open Science Framework (https://osf.io/7v9yk/).