
Figures & data

Figure 1. Statistical analysis of proteomics results: A) Volcano plot showing the differences in the abundance of proteins between the retained placenta (RP; n = 9) and the physiological puerperium (PP; n = 6) groups; B) Principal Component Analysis (PCA) score plot showing samples from cows with RP and PP.
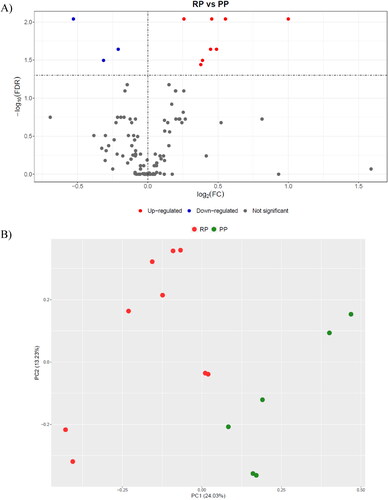
Table 1. The proteins with the different relative abundance (ratio between the amount in an individual sample and internal standard) in the cows with the retained placenta (RP; n = 9) and those with the physiological puerperium (PP; n = 6).
Figure 2. Gene Ontology for the proteins with the different abundance between the RP (n = 9) and PP (n = 6) groups using the PANTHER GO-Slim analysis: A) Molecular function; B) Cellular Component; C) Biological Process.
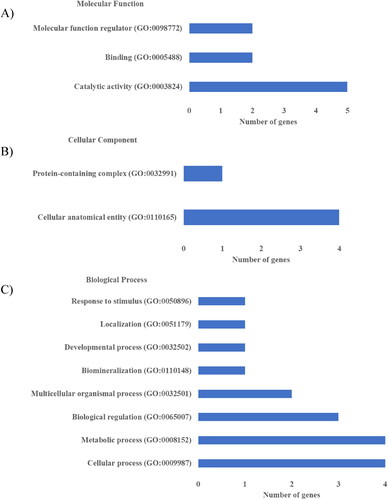
Table 2. Pathway enrichment analysis of the proteins differentially abundant between the group with retained placenta (RP; n = 9) and the group with the physiological puerperium (PP; n = 6). FDR < 0.05 is considered significant.
Table 3. Validation results: protein, results (median and minimum–maximum range) in cows with retention of the placenta (RP; n = 9) and cows with the physiologic puerperium (PP; n = 6), and P–values indicating the significance of differences between the groups (Mann-Whitney U test, P–value < 0.05 is considered significant).
Table 4. Biochemistry parameters/ratios: reference intervals (Laboratory of the Internal Diseases Clinic, Faculty of Veterinary Medicine, University of Zagreb), results (median and minimum–maximum range) in cows with retention of the placenta (RP; n = 9) and cows with the physiologic puerperium (PP; n = 6), and P–values indicating the significance of differences between the groups (Man-Whitney U test, p < 0.05 is considered significant).
Table 5. Results of the ROC analysis for the routine biochemistry parameters with levels differing between cows with retention of the placenta (n = 9) and cows with the physiologic puerperium (n = 6): Area Under the Curve (AUC) with 95% Confidence Interval (CI), P-value, Cut-off, sensitivity (95% CI), and specificity (95% CI).
Figure 3. A graphical representation of the relationship between the number of altered proteins and serum amyloid A (SAA) concentration in serum.
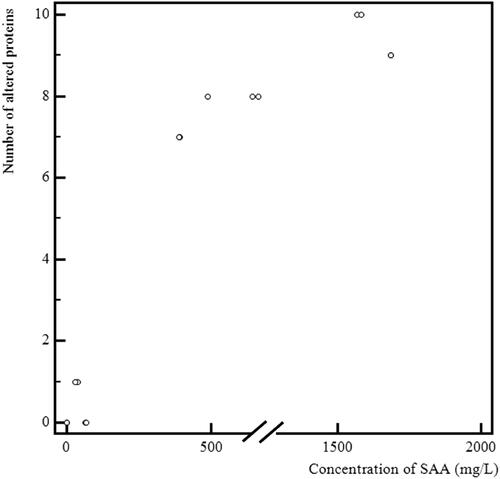
Table 6. Correlation between the number of proteins with the altered abundance and the routine biochemistry parameters: Spearman’s rho rank correlation coefficient (ρ) with the 95% confidence interval and P–value.