
Figures & data
Figure 1. Geographical distribution of sampled animals. Each dot represents where the animal was found, and each diamond represents the location of Wildlife Rehabilitation Centers (WRC) where the animal was admitted for sampling (WRC1-WRC9). The color of each circle indicates the respective WRC where the animals were sampled.
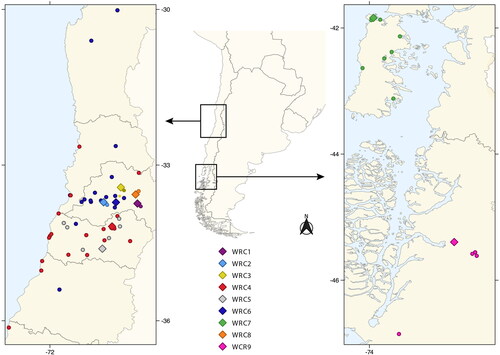
Figure 2. Susceptibility to SARS-CoV-2 infection of sampled animals based on published data (Islam et al. Citation2022; Palmer et al. Citation2021; Parolin et al. Citation2021; Villanueva-Saz et al. Citation2021; Fischhoff et al. Citation2021a; Citation2021b). Since there are no in silico or experimental susceptibility reports for most species (Galictis cuja, Pudu puda, Lontra felina, Lycalopex culpaeus, Lycalopex griseus, Lycalopex fulvipes, Otaria byronia, Arctocephalus australis, Arctocephalus philippi, Arctocephalus tropicalis, Leopardus guigna, and Leopardus colocola), susceptibility was estimated based on taxonomic family. Each color represents the proportion of sampled individuals in each susceptibility category.
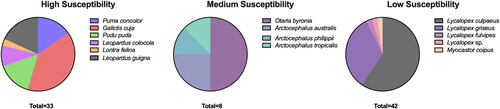
Table 1. Total number of wild animals sampled in this study. Each sampled animal is identified with common name, scientific name, number of sampled animals, wildlife rehabilitation center, number and kind of sample analyzed, and qPCR assay results.
Table 2. Animal species sampled, sample kind, sex, cause of admission and wildlife rehabilitation center of admittance. Samples are listed in chronological order.