Figures & data
Figure 1. Map of the recovering sites of the loggerhead turtles (Caretta caretta) stranded between 2013 and 2018 in coastal areas of Sicily, Southern Italy.
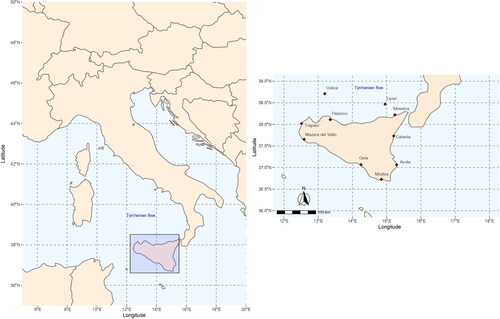
Table 1. Biometric parameters of the 40 specimens of Caretta caretta sampled.
Table 2. Microwave digestion conditions for the muscle and fat samples analysed.
Table 3. As, Cd, and Pb concentrations (mg/kg w.w.) detected in the tissues of the loggerhead turtles analysed.
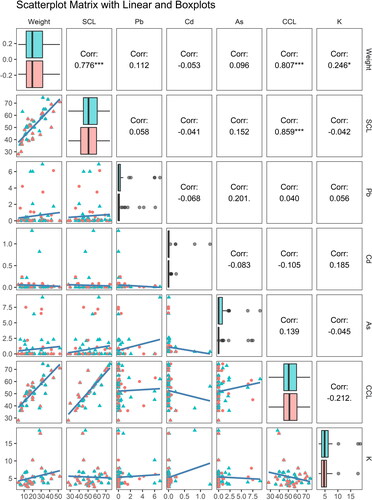
Figure 2. Boxplot, scatterplot, and correlation plot of the morphometric parameters reordered and As, Cd, Pb concentrations sorted by matrices (muscle in red and fat in blue obtained from 40 specimens). SCL = straight carapace length; CCL = curved carapace length. In the scatterplots: triangles = muscle, circle = adipose tissues. In the main diagonal the boxplot divided by group (muscle in red, fat in blue). The six-scatter plot below the principal diagonal showed a linear correlation SCL and weight, CCL and weight, SCL and CCL. The Spearman correlation coefficients between each pair of variables is above the principal diagonal. The correlation between weight and SCL is 0.805 (first row, second column) and supports the conclusion that as SCL increases, weight increase. No correlation was found between trace elements and the other parameters.