
Figures & data
Figure 1. The presence (A, B) and absence (C, D) of renal CABA in median longitudinal (A, C) and transverse (B, D) plane of the feline kidney. Magnified images of the presence of renal CABA from the rectangular dotted region of (A) and (B) are shown in (a) and (b), respectively. The arrowheads indicate focal hyperechogenic trapezoid regions with indistinct or faded margins at 3 and 9 o’clock of the renal cortex compared with the rest of the cortex.
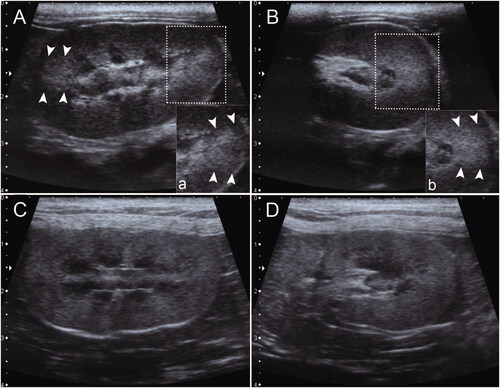
Figure 2. Illustration of echo scores within urinary bladder. The urinary bladder with anechoic urine was scored as 0 (A); less than 10 echoes was scored as 1(B); echoes that occupied less than 25% of the lumen was scored as 2 (C); echoes that occupied 25–50% was scored as 3 (D); echoes that occupied more than 50% was scored as 4 (E).
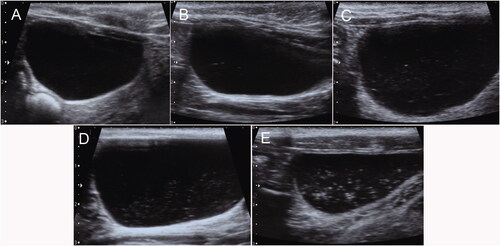
Figure 3. Illustrations of the tissue comparisons between CABA (*) and non-CABA region (#). Hepatic versus splenic echogenicity (A), renal cortex versus splenic echogenicity (B), and renal cortex versus hepatic echogenicity (C). CABA, cortical anisotropic backscatter artifact.
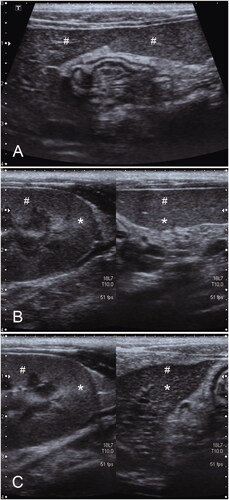
Table 1. Clinical data of all included cats.
Table 2. Associations among the variables with the presence of renal CABA from different observers.
Table 3. Comparison of echogenicity differences among spleen, liver and renal cortex at CABA region and non-CABA region.