Figures & data
Table 1. Age, weight, breed, and type of activity of the dogs enrolled in the study.
Table 2. Clinical data, serum and urinary analytes in specimens grouped as all dogs and as females and males (n = 24; except for blood lactate, n = 12) at rest (T0) and within 30 min after the search activity (T1).
Table 3. Concentrations of total proteins, albumin, and uromodulin in the urine samples at rest (T0) and within 30 min after the search activity (T1).
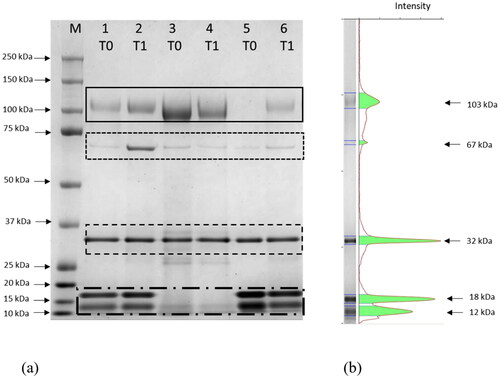
Figure 1. Representative SDS-PAGE gel of the proteins in theurine sampled at T0 and T1 from three female dogs (a). the black continuous box indicates uromodulin (103 kDa); the black dotted box indicates albumin (67 kDa); and the black dashed box indicates the internal standard of quantity (1 μg). a molecular mass marker (M) was also loaded. A representative pherogram (lane 6) is reported in (b).
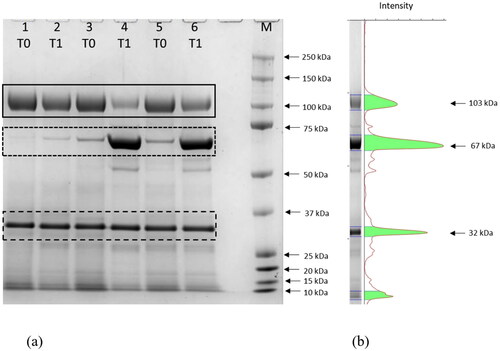
Figure 2. Representative SDS-PAGE gel of the proteins in the urine sampled at T0 and T1 from two intact male dogs (lanes 1, 2, 5 and 6) and one neutered male dog (lanes 3 and 4) (a). the black continuous box indicates uromodulin (103 kDa); the black dotted box indicates albumin (67 kDa), and the black dashed box indicates the internal standard of quantity (1 μg); black dashed and dotted box indicates arginine esterase (18 and 12 kDa). a molecular mass marker (M) was also loaded. A representative pherogram (lane 6) is reported in (b).