
Figures & data
Figure 1. Biosynthesis of remdesivir in human (individual image sourced from PubChem. CID 121304016 (GS-5734), CID 121313150 (GS-704277), CID 44468216 (GS-441524), and CID 56832906 (GS-443902).
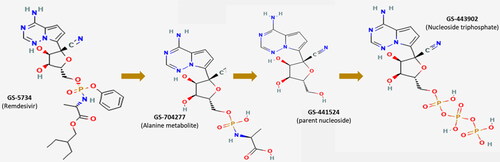
Figure 2. Chromatograms depicting fluorescence excitation (left: max λex: 241 nm) and emission spectrum (right: max λem 405 nm) of GS-441524 (100 ng/mL); y axis is absorbance; x axis is wavelength in nm.
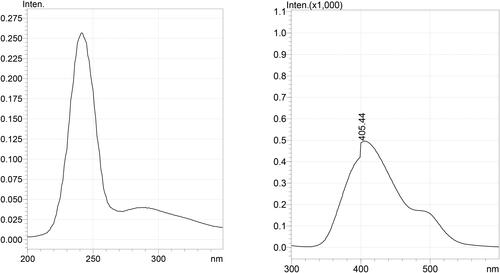
Figure 3. Chromatograms of blank plasma monitored at λex: 245 nm/λem: 395 nm (red trace) and at λex: 250 nm/λem: 475 nm (black trace). Blank plasmas pre-spiked with mixtures of GS-441524 & remdesivir [78.1 (lower blue trace) and 313 ng/mL (higher blue trace), respectively] monitored at λex: 250 nm/λem: 475 nm.
![Figure 3. Chromatograms of blank plasma monitored at λex: 245 nm/λem: 395 nm (red trace) and at λex: 250 nm/λem: 475 nm (black trace). Blank plasmas pre-spiked with mixtures of GS-441524 & remdesivir [78.1 (lower blue trace) and 313 ng/mL (higher blue trace), respectively] monitored at λex: 250 nm/λem: 475 nm.](/cms/asset/cf7f2d84-e2a6-4a54-8937-9632973fce2b/tveq_a_2246553_f0003_c.jpg)
Figure 4. Typical chromatograms of blank plasma (black trace); blank plasma pre-spiked with a mixture of GS-441524, remdesivir, and GS-443902 (blue trace), a mixture of GS-441524, remdesivir, and alanine metabolite (red trace), and a mixture of medications often used in FIP patients for initial supportive care or sedation (see methods) (brown trace). No peaks are interfered with retention time (RT) of GS-441524 (RT: 4.78 min). Rt of remdesivir: 9.95 min; Rt: Alanine metabolite: 2.21 min; GS-443902 (1.98 min).
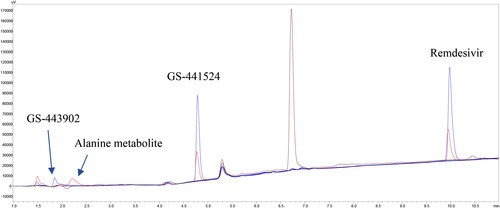
Table 1. Intra- and inter day precision and trueness of QCs (GS-441524).
Table 2. Three cycle freeze and thaw stability (GS-441524) (n = 3).
Figure 5. Chromatograms of plasma GS-441524 after single IV injection of remdesivir (15 mg/kg BW); t = 0 hr (black trace), 1 hr (pink trace), 2 hr (blue trace), 8 hr (brown trace), 20 hr (green trace), and 24 hr (dark blue trace).
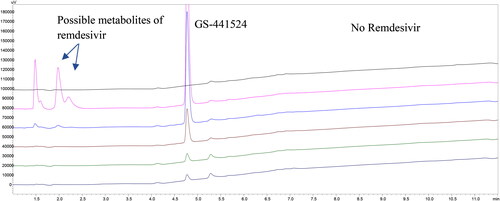
Figure 6. * Semi-logarithmic plasma GS-441524 concentrations vs. time curve in a cat with FIP following IV injection of remdesivir 15 mg/kg BW (red curve; n = 1); trough plasma GS-441524 concentrations after the administrations of remdesivir (9.87–15 mg/kg BW, IV or SC) in cats with FIP (n = 11); trough GS-441524 range from 23.7–190.1 ng/mL (84.9 ± 61.9 ng/mL, avg ± SD).
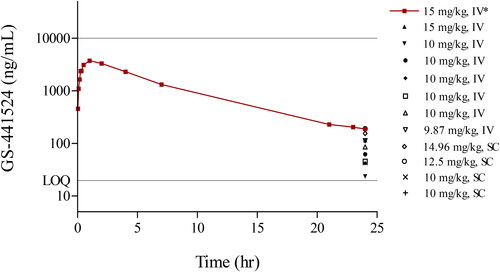
Table 3. Analytical methods to quantify GS-441524 in biological fluid (plasma).
Data availability statement
The data supporting the findings of this study are available from Dr. Benjamin Kimble ([email protected]) upon request.