
Figures & data
Table 1. Databases searched and number of hits.
Figure 1. Flow diagram of the studies included in this meta-analysis.
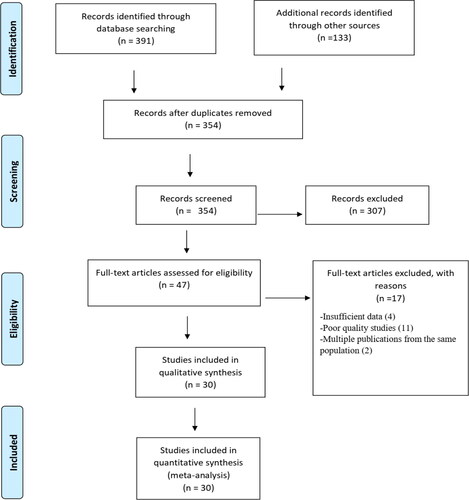
Table 2. Main characteristics of studies included in the meta-analysis.
Figure 2. Distribution of the number of studies on the prevalence of camel brucellosis in Sudan over time.
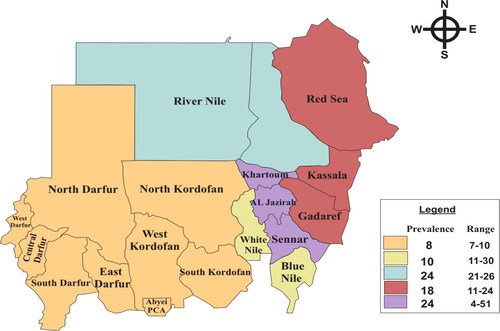
Table 3. Risk factors of camel brucellosis in Sudan.
Figure 3. Forest plot (random-effects model) for the pooled prevalence of camel brucellosis in Sudan.
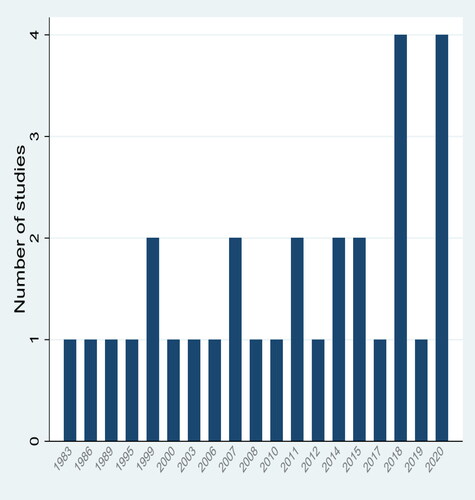
Figure 4. Forest plot (random-effects model) for the pooled prevalence of brucellosis in males and females camel Sudan.
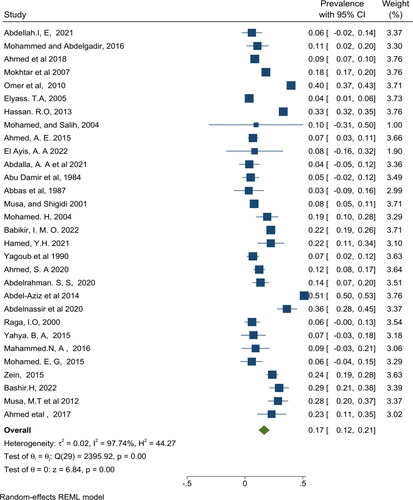
Figure 5. Forest plot (random-effects model) for the pooled prevalence of camel brucellosis in different age groups in Sudan.
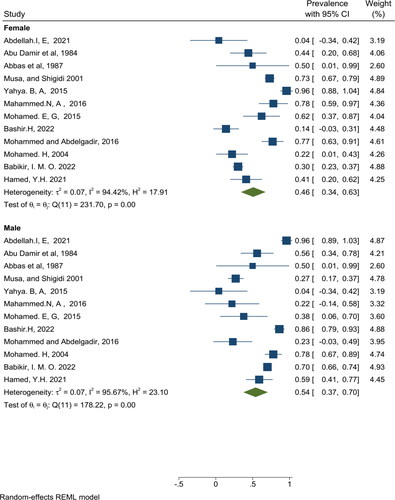
Figure 6. The geographical distribution of camel brucellosis pooled prevalence in Sudan by regions (blue for the northern region, red for the eastern region, purple for the central region, yellow for the southern region, and orange for the western region).
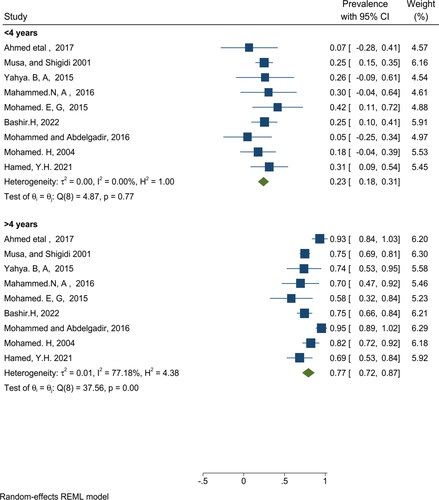
Figure 7. Correlation of prevalence of Brucellosis in dromedary camel based on linear model regression; (A) sample size, (B) year of study, (c) diagnostic method, (D), brucellosis species, and (E) study region.
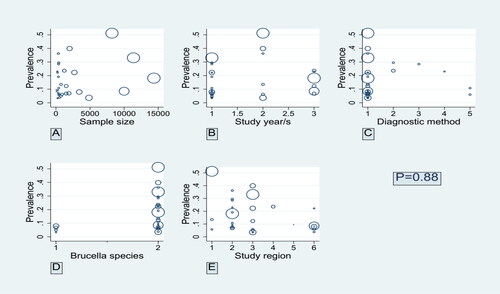
Figure 8. Funnel plot for assessing publication bias in the Pool prevalence of camel brucellosis in Sudan.
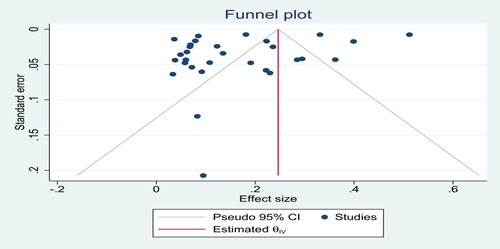
Table 4. Subgroup analysis of the effect of gender, age, Brucella species, study region, study years, camel rising purpose, grazing system, and previous history of abortion on the pooled prevalence of camel brucellosis (based on a random-effects model).
Table 5. Heterogeneity-related variables for the pooled prevalence of camel brucellosis in the current meta-analysis (based on meta-regression).