Figures & data
Figure 1. The definitive diagnosis of canine bronchomalacia was made by bronchoscopy in this study. (A) Bronchoscopic view showing severe collapse of the left and right principal bronchus (LPB and RPB). (B) Bronchoscopic image at the same level of the carina from a dog without bronchomalacia. (C, D) Bronchoscopic images demonstrating the dynamic collapse of the lobar bronchus of the accessory lobe (RB3) and the right caudal lobe (RB4) in a dog with severe bronchomalacia.
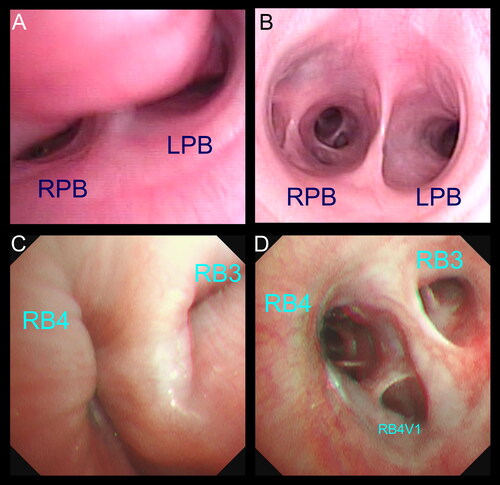
Table 1. The overall severity of bronchomalacia was based on the degree of collapse and the total number of airways affected.
Figure 2. Diagram of the set-up used to measure tidal breathing signals in dogs.
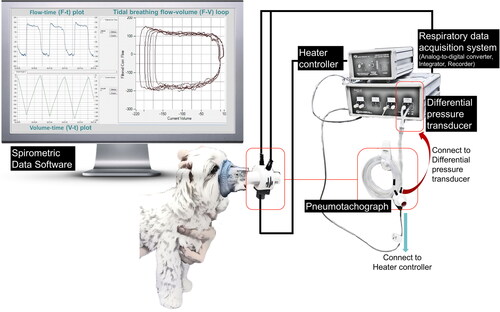
Table 2. Basic ventilatory parameters (median with range) in dogs with bronchomalacia and control dogs.
Table 3. Spirometric parameters from flow-volume (F-V) loop, flow-time (F-t) plot, and volume-time (V-t) plot (median with range) in dogs with bronchomalacia and control dogs.
Figure 3. A flow-time (F-t) plot from a dog with severe bronchomalacia, showing a significantly prolonged low-flow expiratory phase. A F-t plot from a control dog was shown on the upper left Corner.
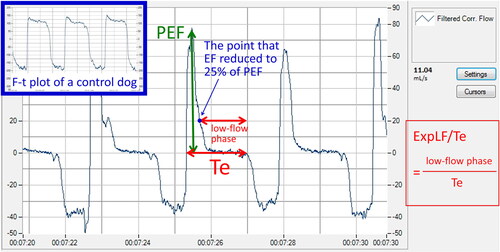
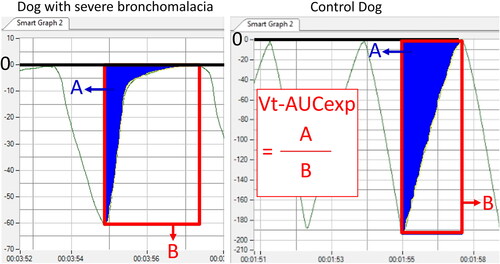
Figure 4. The volume-time (V-t) plots from a dog with severe bronchomalacia (left) and a control dog (right). an exponential shape of the expiratory curve was noted in dogs severe bronchomalacia, resulting in a low proportion of area under expiratory curve on V-t plot (Vt-AUCexp).