Figures & data
Figure 1. Representative figure displaying the four differing positions in the 37 amino acid peptide strands of human (hIAPP) and feline (fIAPP) islet amyloid polypeptide.
Scheme 1. Preparation of diaryl urea derivatives; dichloromethane (DCM), room temperature (rt), 8–12 h. Ar1 (R1) is a placeholder for one of the three series: 2-aminofluorene, 4-morpholinoaniline, or 4-aminoindole. Ar2 (R2) refers to one of the following substituents: o-methylphenyl, o-methoxyphenyl, o-fluorophenyl, o-nitrophenyl, p-(trifluoromethyl)phenyl, o,p-dimethoxylphenyl, o-methylchloro, m-(trifluoromethyl)phenyl, or o,p-dimethoxy.
Table 1. Chemical structure, physicochemical descriptors, and the effect of the 2-aminofluorene series of compounds on hIAPP and fIAPP aggregation measured as fluorescence intensity using ThT assay.
Table 2. Chemical structure, physicochemical descriptors, and the effect of the 4-morpholinoaniline series of compounds on hIAPP and fIAPP aggregation measured as fluorescence intensity using ThT assay.
Table 3. Chemical structure, physicochemical descriptors, and the effect of the 4-aminoindole series of compounds on hIAPP and fIAPP aggregation measured as fluorescence intensity using ThT assay.
Figure 2. Kinetics of IAPP fibril formation obtained with different diaryl derivatives of urea monitored with the thioflavin T (ThT) fluorescence assays. In this first-tier assay, compounds were tested at a final concentration of 100 μM in the presence of hIAPP and fIAPP at 10 μM. Molar ratio peptide: compound is 1:10. Series 1, 2, and 3 represent the 2-aminofluorene, morpholino, and 4-aminoindole, respectively.
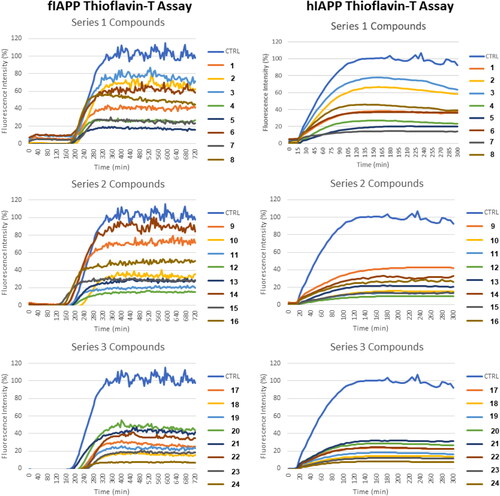
Figure 3. Kinetics of IAPP fibril formation with increasing doses of three synthesized compounds 12, 23, and 24, assessed via thioflavin T (ThT) fluorescence assay. The original stock of the compound was tested at 100, 50, 25, 12.5, 6.25, 3.125, and 1.56 µM concentration. These compounds were tested in the presence of hIAPP and fIAPP at 10 μM.
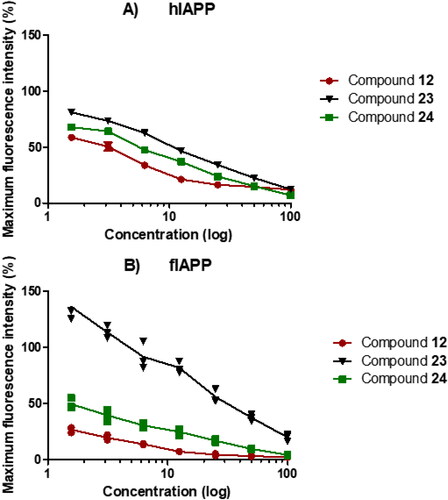
Figure 4. Size of hIAPP based on light scattering. Control at 60 min showed one major fibril peak in the 1000 nm range. The two tested compounds (12 and 24) were individually added to aliquots of hIAPP and incubated for 60 min before analysis to determine the size of the particles contained within the sample.
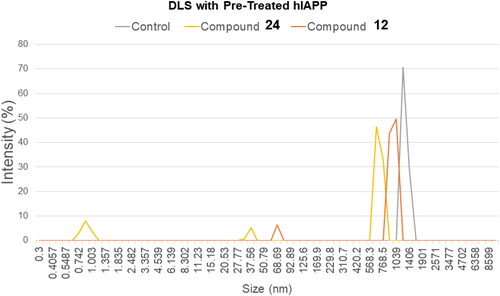
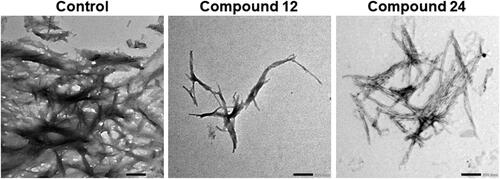
Figure 5. TEM imaging of amylin fibrils incubated with two unique treatments. Samples of fIAPP were solubilized at 10 µM in PBS buffer. Samples were incubated with DMSO (0.25%), compound 12, or compound 24. After the end of fibril formation kinetics (≤ 12 h), samples were deposited on copper grids and stained for TEM visualization. All images are displayed at 20k magnification.