Figures & data
Figure 1. Graphical representation of a TEG performed on the blood of a healthy dog (left) and on the same patient following the addition of etamsylate 250 μM (right). The most significant finding is an increase in the percentage of clot lysis at 30 min (LY30) and 60 min (LY60).
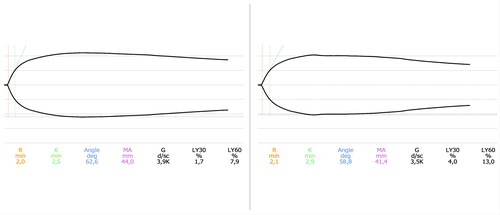
Table 1. Comparison of TEG values of paired blood samples: control and with the addition of etamsylate 250 μM.
Table 2. Comparison of TEG values of paired heparinised blood samples (1 U/mL) without and with the addition of etamsylate 250 μM.
Table 3. TEG values obtained following the addition of Incremental doses of etamsylate to heparinised blood (1 U/mL).
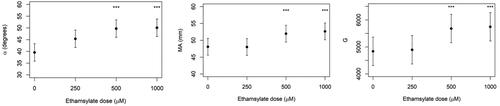
Figure 2. TEG variables MA, α angle and G obtained from adding Increasing doses of etamsylate to heparinised canine blood (1 U/mL). There are statistically significant increases in MA, α angle and G after adding etamsylate at 500 and 1000 μM, indicating partial reversal of anticoagulation. TEG: thromboelastography; MA: maximum amplitude. ***= statistically significant estimate.