
Figures & data
Table 1. The information and primer details of Canine 25 A kit.
Figure 1. Markers and dye configuration of Canine 25 A kit.
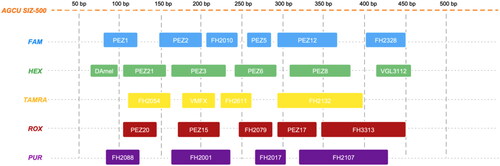
Figure 2. Allelic ladder of Canine 25 A kit, constructed with 24 STR loci and amelogenin.
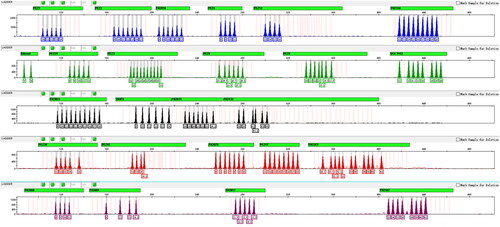
Figure 3. The detection rate of alleles with the Canine 25 A kit at different concentrations of primers, reaction mix and C-Taq DNA polymerase.
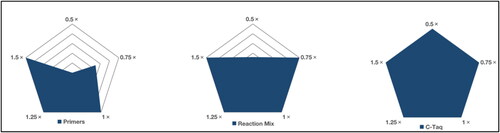
Figure 4. Electropherogram of different PCR reaction components in Canine 25 A kit: A) 0.75× reaction mix, B) 1× primers; C) 0.5× C-Taq DNA polymerase.
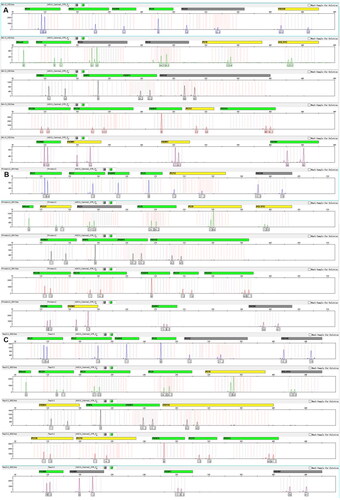
Figure 5. DNA profiles obtained from Canine 25 A kit at different PCR conditions: A) annealing temperatures and B) cycle numbers.
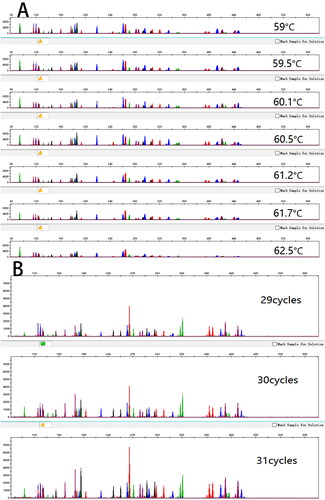
Figure 6. Heatmap summarizing the sensitivity results of six serial dilutions (from 2.0 ng to 0.0625 ng) of control DNA with three biological replicates (-1, -2, -3), using a threshold set at 50 RFU. Green represents peak height ratio >50% within the same locus. Yellow represents peak height ratio <50% and >30% within the same locus. Red represents allele loss.
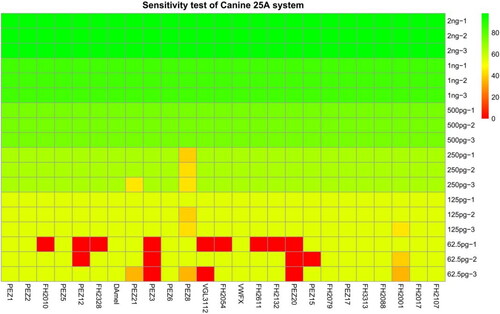
Figure 7. Full profiles can be obtained when the template amount is 0.125 ng in a reaction volume of 25 μL.
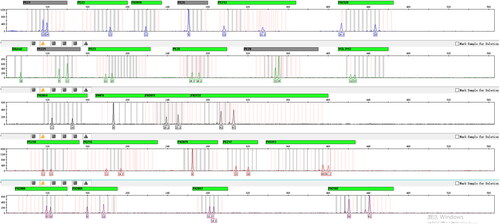
Figure 8. Results of species specificity of Canine 25 A kit.
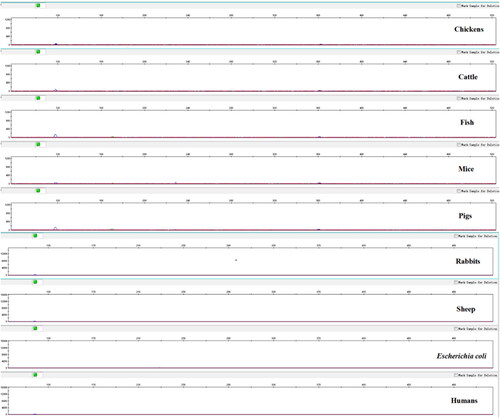
Figure 9. DNA profile analysis of mixture study: A) dog-dog mixture (1:5), B) human-dog mixture (1:5), and C) human genotype detection from mixture DNA using AGCU Expressmarker 16CS Kit.
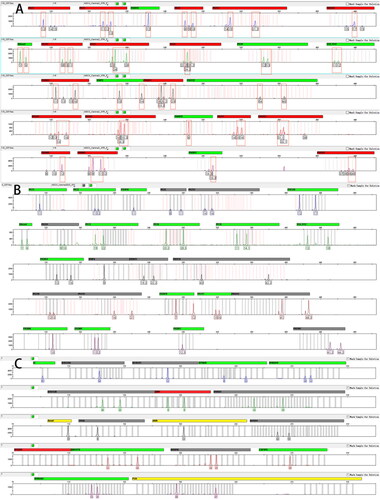
Figure 10. Alleles detected of Canine 25 A kit at different concentrations of the inhibitors. The X-axis represents the different concentrations, while the Y-axis represents the proportions of the detected loci at the specific concentration.
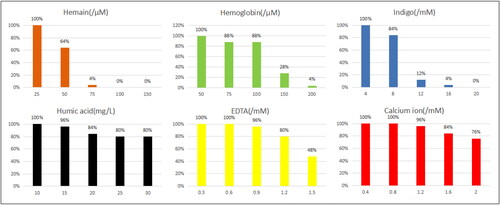
Figure 11. Reproducibility of the Canine 25 A kit on different capillary electrophoresis platforms: ABI 3130XL (A) and ABI 3730XL (B).
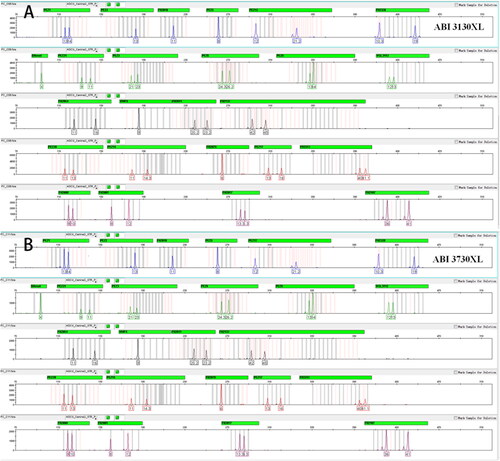
Figure 12. Size precision of the Canine 25 A allelic ladder on a 3130XL Genetic Analyzer.
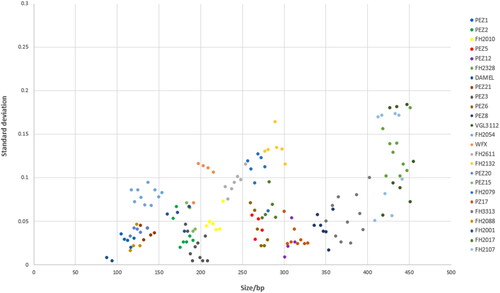
Figure 13. Results of peak balance for Canine 25 A kit: A) peak height ratios of the minimum RFU to the maximum RFU for loci marked with the same fluorescent dye, B) the average RFU values of each group of loci marked with five different fluorescent dyes.
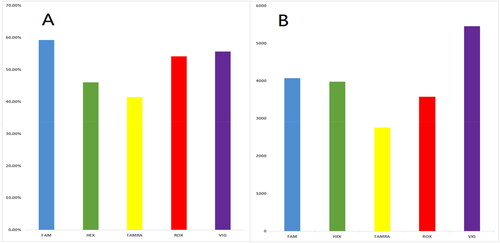
Table 2. Stutter values for the 25 canine STRs included in the Canine 25 A kit.
Figure 14. DNA profiles obtained from case samples related to a dog attack incident using the Canine 25 A kit: A) Rottweiler, B) Poodle, C) German Shepherd Dog, D) shirt with dog bite marks, and E) pants with dog bite marks.
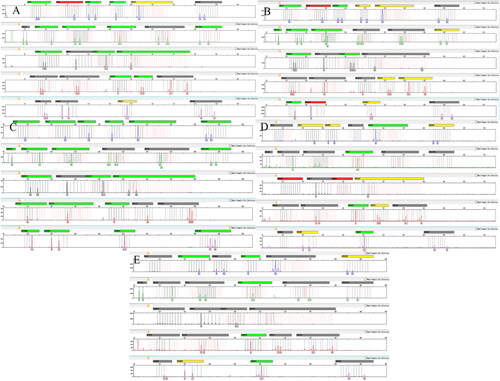
Table 3. The genotype of casework samples.
Table 4. The parentage index of Canine 24 STR loci for a case involving a father-son duo.
Figure 15. Forensic parameters of 24 canine STR loci in 16 canine breeds. The parameters provided include polymorphism information content (PIC), power of discrimination (PD), observed heterozygosity (Hobs), power of exclusion (PE), typical paternity index (TPI), and p value of Hardy-Weinberg’s equilibrium (p-HW). Each breed is represented by a distinct letter label. The breeds included in the figure are: A) Italian cane corso, B) bloodhound, C) Schnauzer, D) Rottweiler, E) Chinese Kunming dog, F) Welsh Corgi Pembroke, G) Golden Retriever, H) Shiba, I) German spitz, J) Bichon Frise, K) German Shepherd dog, L) French bulldog, M) Poodle, N) Labrador Retriever, O) Belgian Shepherd dog, and P) English Springer Spaniel.
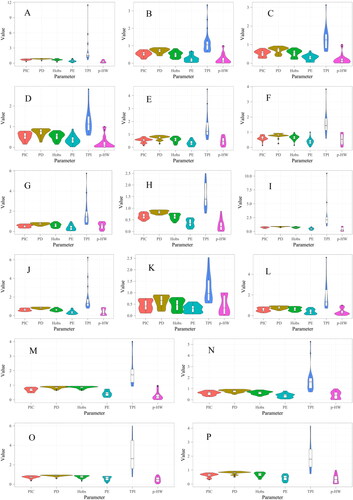
Table 5. Specific information and cumulative paternity index of 16 Canine breeds.