
Figures & data
Table 1. qRT-PCR primer sequences.
Figure 1. Expression screening and localization of BMNCR in S. aureus BMECs. (A) The number of predicted and aligned lncRNAs by high-throughput sequencing in dairy cows. (B) The number of differentially expressed lncRNAs in S. aureus induced mammary gland tissues compared to normal mammary gland tissues. (C) The expression levels of 18 differentially expressed lncRNAs on S. aureus induced BMECs (E, experiment group) and normal BMECs (C, control group) were detected by qRT-PCR (n = 3). (D) The expression level of BMNCR on S. aureus induced BMECs (inflammatory cells) and normal BMECs (normal cells). (E) The full-length sequence of BMNCR obtained by RACE. M, DL2000 DNA marker. (F) Distribution of BMNCR in nucleus and cytoplasm in BMECs. Data are means ± SE of n = 3 independent experiments, each performed in triplicate, and normalized to GAPDH. **, p < .01.
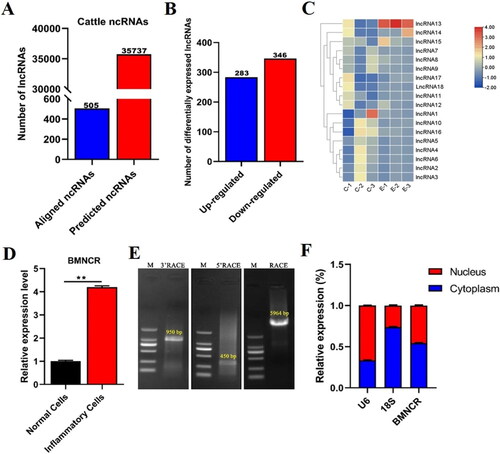
Figure 2. BMNCR Facilitated proliferation and attenuated apoptosis in BMECs. (A) qRT-PCR detected the expression efficiency of BMNCR after transfected three BMNCR siRNAs, respectively. (B) The expression levels of inflammation-related cytokines were validated by RT‐qPCR after treated siBMNCR for 48 h. (C) CCK8 assay exploring the function of BMNCR on the viability of BMECs. (D) EdU assay detected the number of BMECs treated with siBMNCR. (E) The proportion of EdU positive cells was counted by ImageJ. (F) Cell apoptosis was determined by flow cytometry after transfected with siBMNCR. (G) Distribution map of BMECs apoptosis. (H) Cell apoptosis index was counted by the sum of early and late apoptosis. Data are means ± SE of n = 3 independent experiments, each performed in triplicate, and normalized to GAPDH. *, p < .05 and **, p < .01.
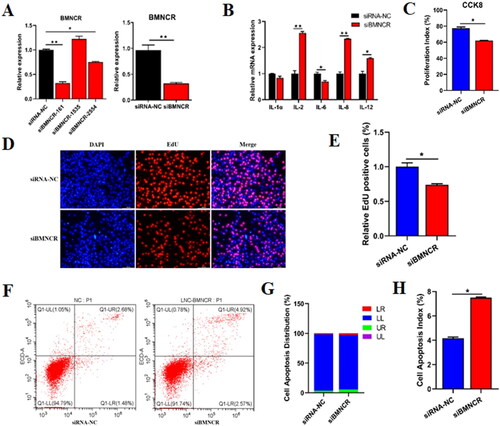
Figure 3. BMNCR Bind with miR-145 and downregulated miR-145 expression. (A) After transfected siBMNCR into BMECs for 48 h, the expression levels of 11 miRNAs which predicted by RNAhybrid and miRanda were detected by qRT-PCR. (B) BMNCR negatively regulated the expression of miR-145. (C) The potential binding seeds between BMNCR and miR-145 were predicted by RNAhybrid. (D) Insert BMNCR-WT or MUT sequences into psi-Check2 vector to identify the binding capacity. (E) Dual-luciferase reporter assay was carried out to identify the binding capacity between BMNCR and miR-145. Data are means ± SE of n = 3 independent experiments, each performed in triplicate, and normalized to GAPDH. *, p < .05 and **, p < .01.
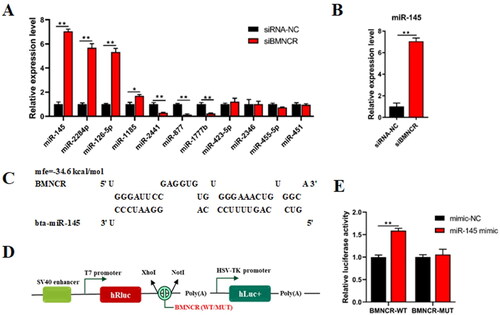
Figure 4. Functional roles of miR-145 on proliferation and apoptosis of BMECs. (A) qRT-PCR detected the overexpression (mimic) or Interference (inhibitor) efficiency of miR-145. The expression levels of inflammation-related cytokines were validated by RT‐qPCR after treated miR-145 mimic (B) or miR-145 inhibitor (C). (D) EdU assay detected the number of BMECs after treated with miR-145 mimic or inhibitor. (E) The proportion of EdU positive cells was counted by ImageJ. (F) Cell apoptosis was determined by flow cytometry after transfected with miR-145 mimic or inhibitor. (G) Distribution map of BMECs apoptosis. (H) Cell apoptosis index was counted by the sum of early and late apoptosis. Data are means ± SE of n = 3 independent experiments, each performed in triplicate, and normalized to GAPDH. *, p < .05 and **, p < .01.
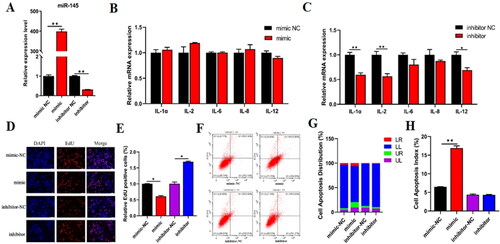
Figure 5. CBFB was the direct target gene of miR-145 and negatively regulated by miR-145. (A) the expression levels of 23 potential target genes were detected by qRT-PCR after transfected miR-145 mimic or inhibitor into BMECs for 48 h. (B) the mRNA level of CBFB was explored by qRT-PCR. (C) the protein level of CBFB was explored by Western blot. (D) the relative protein level of CBFB was calculated by ImageJ. (E) the Conservative binding seeds in the 3’UTR of CBFB were predicted by TargetScan in 10 different species. (F) The potential binding sites between miR-145 and CBFB. (G) Insert CBFB-WT or MUT sequences into psi-Check2 vector. (E) Dual-luciferase reporter assay was carried out to identify the binding capacity between miR-145 and CBFB. Data are means ± SE of n = 3 independent experiments, each performed in triplicate, and normalized to GAPDH. *, p < .05 and **, p < .01.
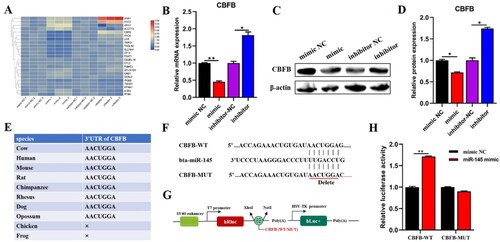
Figure 6. BMNCR could regulate the expression of CBFB in BMECs. After transfected siBMNCR into BMECs for 48 h. (B) The mRNA level of CBFB was explored by qRT-PCR. (C) The protein level of CBFB was explored by Western blot. (D) The relative protein level of CBFB was calculated by ImageJ. Data are means ± SE of n = 3 independent experiments, each performed in triplicate, and normalized to GAPDH. *, p < .05 and **, p < .01.
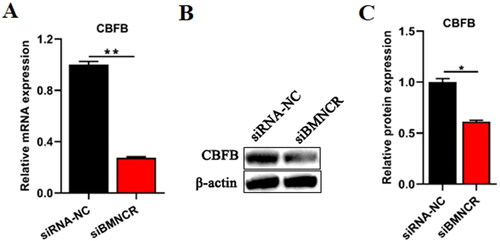
Figure 7. CBFB could modulate proliferation and apoptosis in BMECs. (A) qRT-PCR detected the expression efficiency of CBFB after transfected three siRNAs of CBFB, respectively. After transfected siCBFB into BMECs for 48 h, (B) mRNA level of CBFB was explored by qRT-PCR. (C) The protein level of CBFB was explored by Western blot. (D) The relative protein level of CBFB was calculated by ImageJ. (E) The expression levels of inflammation-related cytokines were validated by RT‐qPCR after treated siCBFB into BMECs for 48h. (F) EdU assay detected the number of BMECs treated with siCBFB. (G) The proportion of EdU positive cells was counted by ImageJ. (H) Cell apoptosis was determined by flow cytometry after transfected with siCBFB. (I) Distribution map of BMECs apoptosis. (J) Cell apoptosis index was counted by the sum of early and late apoptosis. Data are means ± SE of n = 3 independent experiments, each performed in triplicate, and normalized to GAPDH. *, p < .05 and **, p < .01.
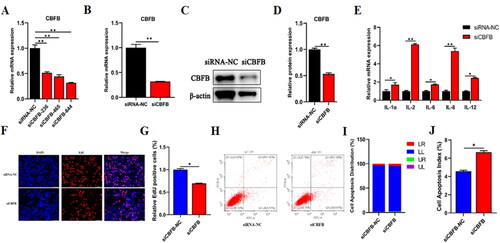
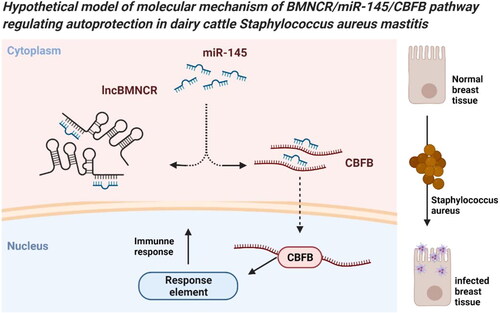
Figure 8. A proposed model of BMNCR regulating CBFB by sponge miR-145 in BMECs.
Supplemental Material
Download PDF (204.8 KB)Data availability statement
The authors confirm that the data supporting the findings of this study are available within the article.