Figures & data
Figure 1. Representative visible spectra obtained from Congo red (CR) binding assays of the eight serum amyloid A1 synthetic peptides of the region 1-25 at 500 µM. Optical density (OD) data were plotted as function of wavelength (nm). The change in optical density (higher and right shift) is indicative of CR binding to β-plated sheets. Optical density measurements were recorded at 25 °C in 25 mM Tris buffer (pH 8) and 50% hexafluoroisopropanol (HFIP) after 5 days of incubation. ID# 1: human; ID# 2: common bottlenose dolphin; ID# 3: donkey; ID# 4: rhesus monkey; ID# 5: alpine ibex; ID# 6: Lesser-Egyptian jerboa; ID# 7: domestic ferret; ID# 8: chamois.
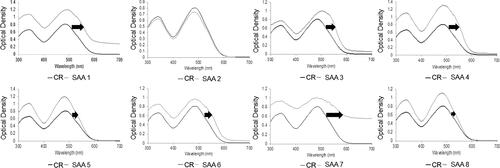
Table 1. 1-25 Amino acid peptide sequence library of the serum amyloid A1 (SAA1) in eight species.
Figure 2. Comparison of Thioflavin T (ThT) fluorescence intensity obtained at the end of fibrilization kinetics for synthetic SAA 1-25 fragments resourced from amino acid sequences of different animal species. The experiments were conducted using a concentration of 500 μM in 25 mM Tris buffer (pH 8) and 50% hexafluoroisopropanol (HFIP). Fragment peptides were monitored at 37 °C for 120 h. Average represents experimental triplicate. Fluorescence background signal was subtracted. Each numerical value in the figure corresponds with the respective organism as presented in . Specifically, ID# 1: human; ID# 2: common bottlenose dolphin; ID# 3: donkey; ID# 4: rhesus monkey; ID# 5: alpine ibex; ID# 6: Lesser-Egyptian jerboa; ID# 7: domestic ferret; ID# 8: chamois.
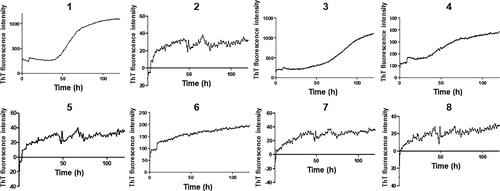
Figure 3. Comparison of the Thioflavin T (ThT) fluorescence intensity. Graphs represent each species’ fibrilization intensity over 120 h (five days) in incubation at 37 °C. Three samples ran simultaneously were then averaged subtracting the background intensity from each prior to creating the graph. Error bars represent SEM. ID# 1: human; ID# 2: common bottlenose dolphin; ID# 3: donkey; ID# 4: rhesus monkey; ID# 5: alpine ibex; ID# 6: Lesser-Egyptian jerboa; ID# 7: domestic ferret; ID# 8: chamois.
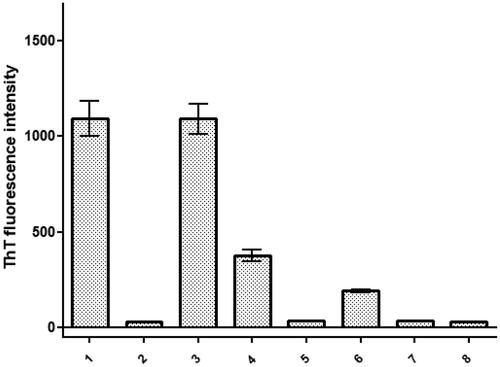
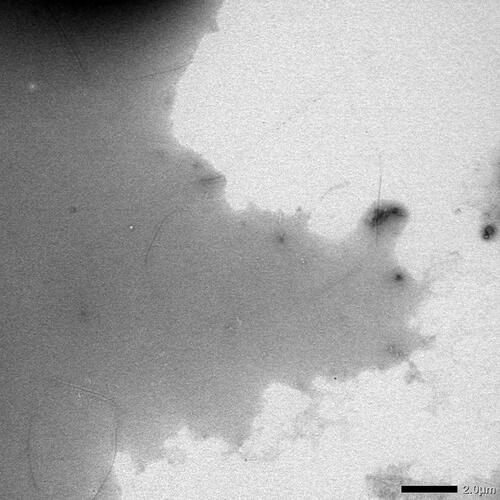
Figure 4. Transmission electron microscopy (TEM) was used to observe the different synthetic SAA fragment peptides solubilized at 500 µM in 25 mM Tris buffer (pH 8) and 50% hexafluoroisopropanol (HFIP), and subsequently incubated at 37 °C for seven days, at a magnification of 40K. Notation a corresponding to the human SAA1 peptide. Notation B corresponding to the common bottlenose dolphin SAA1 peptide. Notation C corresponding to the donkey SAA1 peptide. Notation D corresponding to the rhesus monkey SAA1 peptide. Notation E corresponding to the alpine ibex SAA1 peptide. Notation F corresponding to the Lesser-Egyptian jerboa SAA1 peptide. Notation G corresponding to the domestic ferret SAA1 peptide. Notation H corresponding to the chamois SAA1 peptide. Scale bar = 200 nm.
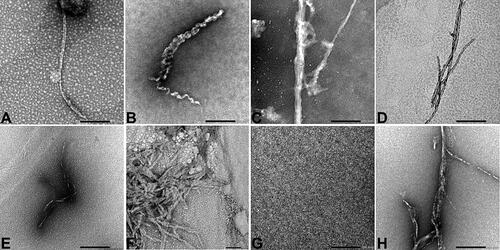
Figure 5. Photomicrograph of the domestic ferret SAA1 peptide taken at low magnification (2000) by transmission electron microscopy. Experimental conditions are identical as in .