
Figures & data
Table 1. Nucleotide sequence, position, and amplicon size of primers used in this study.
Figure 1. Feline calicivirus (FCV) strain differentiation by high-resolution melting (HRM) analysis. (A) HRM normalized the melt curve of eight unique patterns. (B) HRM difference graph of the eight FCV strains using the vaccine strain (nobivac® 1-HCPCh) as a reference strain. HRM normalized and difference graphs could distinguish eight FCV-strain typing patterns from 11 strain templates.
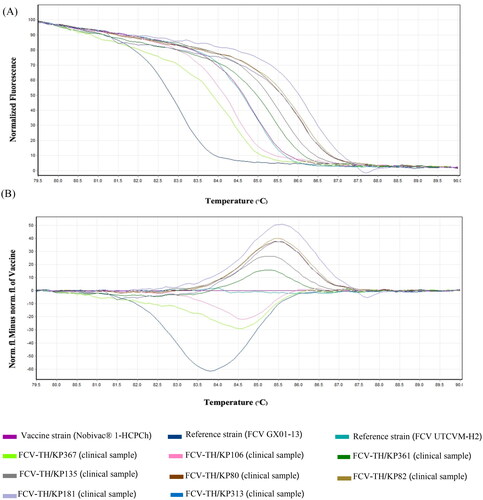
Figure 2. Linear regression analysis of the relationship between the percentage of the C:G content of the PCR product and Tm value.
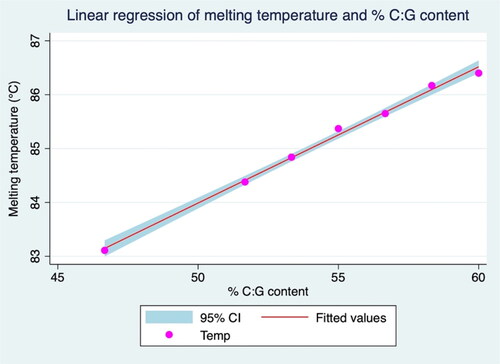
Table 2. Linear regression model showing the relationship between % C:G of PCR product sequence and melting temperature deriving from HRM assay.
Figure 3. Differentiation efficacy of qPCR-HRM between FCV-Vac, VS-FCV, and FCV-TH wild type (A) HRM normalized the melt curve of ten unique patterns. (B) HRM difference graph of the ten FCV strains using the vaccine strain (purevax® RCPCh) as a reference strain. HRM normalized and difference graphs could distinguish between FCV-Vac, VS-FCV, and FCV-TH wild type.
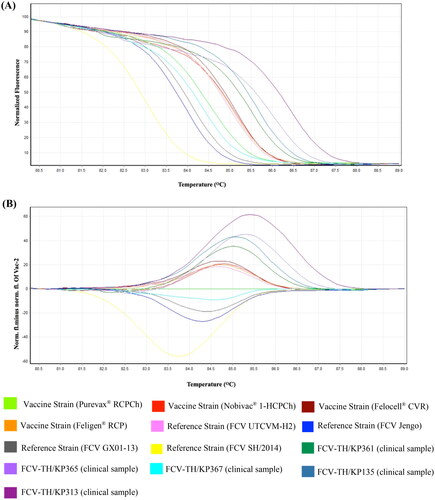
Figure 4. Analytical sensitivity of the high-resolution melting (HRM) assay. (A) The quantitative assessment in a tenfold dilution of feline calicivirus (FCV)-synthesis string DNA (6.18 × 101 and 6.18 × 10⁸ copies/µl) was evaluated using qPCR and analyzed by HRM software. (B) The normalized graph of HRM analysis revealed a normalization region between 80 and 89 °C with a confidence threshold of 95%. The cutoff Ct value of the positive sample was set at Ct < 35. (C) The standard curve for indicating the efficiency of the qPCR detection assay by the x-axis refers to the tenfold dilution of FCV-synthesis string DNA (ng/µl). In contrast, the y-axis refers to the corresponding Ct values. The assay is linear in the range of 6.18 × 101 to 6.18 × 10⁸ template copies/µl, with a determination coefficient (R2) of 0.998 and reaction efficiency of 96.13%.
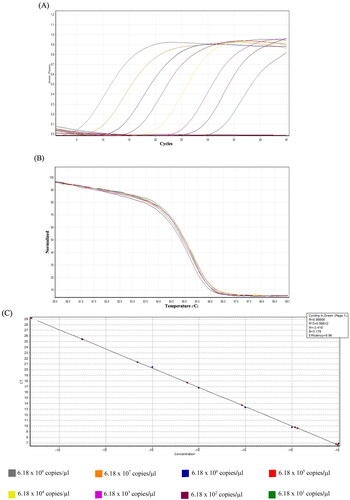
Figure 5. Analytical specificity of the high-resolution melting (HRM) assay. The graph shows positive results from the positive control (PTC: string DNA fragment from the feline calicivirus [FCV] vaccine strain with concentration at 6.2 × 10⁵ copies/µl) and FCV-positive clinical sample. The non-template control (NTC) and other feline virus templates, including FHV-1, FIV, FeLV, FCoV, and FeMV, showed amplification signals over positive cutoff values (Ct > 35).
![Figure 5. Analytical specificity of the high-resolution melting (HRM) assay. The graph shows positive results from the positive control (PTC: string DNA fragment from the feline calicivirus [FCV] vaccine strain with concentration at 6.2 × 10⁵ copies/µl) and FCV-positive clinical sample. The non-template control (NTC) and other feline virus templates, including FHV-1, FIV, FeLV, FCoV, and FeMV, showed amplification signals over positive cutoff values (Ct > 35).](/cms/asset/f033a0f7-c2d8-49b9-967b-c283ccf7fc18/tveq_a_2272188_f0005_c.jpg)
Figure 6. Analytical efficacy of the high-resolution melting (HRM) assay for strain differentiation between the wild-type feline calicivirus-Thai (FCV-TH) strain and vaccine strain (FCV-Vac). The patterns of the HRM normalized graph (A) and HRM difference graph (B) demonstrate detectability patterns at each various concentration ratio. Melt curve analysis from the HRM assay (C) indicated the derivative melt peak patterns that seem likely to correspond to the divergence ratio of the strain mixture.
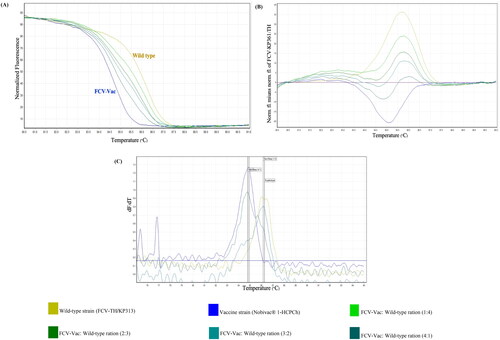
Table 3. Result comparison between qPCR-HRM assay and conventional RT-PCR.
Table 4. Mean melting temperature (Tm) and standard deviation (SD) within the group of each feline calicivirus (FCV) strain typing pattern detected from clinical samples.
Supplemental Material
Download MS Word (436 KB)Data availability statement
The authors guarantee that the data supporting the findings in this study are available within this article and its supplementary material. The raw data that encourage the finding of this study are available from the corresponding author, upon reasonable request. Nine sequences of the FCV-TH strains (FCV-TH/KP80, FCV-TH/KP82, FCV-TH/KP100, FCV-TH/KP103, FCV-TH/KP105, FCV-TH/KP181, FCV-TH/KP276, FCV-TH/KP313, and FCV-TH/KP361) obtained from this study have been deposited in NCBI GenBank under accession numbers OM982622, OM982623, OM982625, OM982626, OM982627, OM982629, OM982630, OM982631, and MZ542330, respectively.