
Figures & data
Figure 1. Relative abundance of significantly altered metabolites in dogs fed a low-protein/high carbohydrate (LPHC) vs. high-protein/low carbohydrate (HPLC) diet. Bar charts with proportions on the left represent the relative abundance of the average peak intensity of the metabolite in diet groups. Values and ranges of 95% confidence intervals for metabolite relative abundances are presented on the right bars. Asterisks with numbers indicate significant differences and corrected p-values.
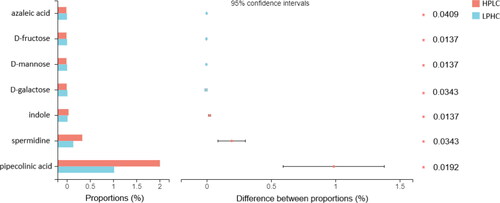
Figure 2. Overview of metabolic pathways associated with amino acid metabolism with significant differences. Red hexagons are compounds (Tier level 5 according to Schymanski et al. Citation2014) significantly affected by the diets; pink hexagons are detected metabolites linked to the pathway detected, but not significantly different between groups.
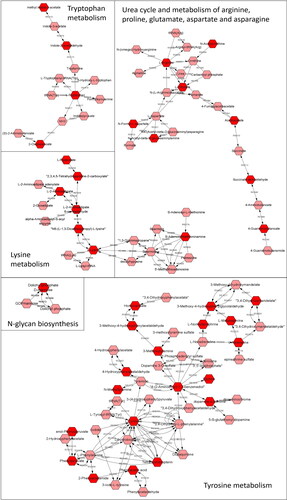
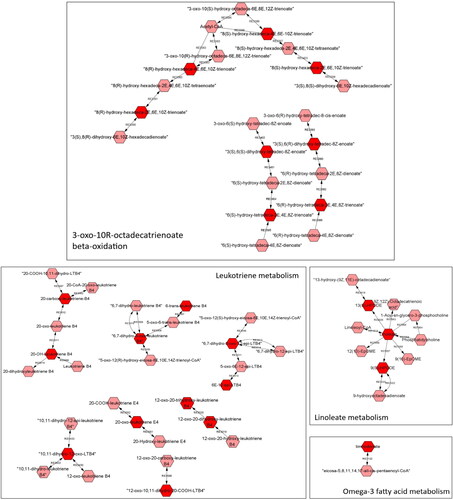
Figure 3. Overview of metabolic pathways associated with fat and fatty acid metabolism with significant differences. Red hexagons are compounds (Tier level 5 according to Schymanski et al. Citation2014) significantly affected by the diets; pink hexagons are detected metabolites linked to the pathway detected, but not significantly different between groups.
Supplemental Material
Download Zip (3 MB)Data availability statement
The datasets used and/or analysed during the current study are available from the corresponding author upon reasonable request.