
Figures & data
Table 1. Primers used in PCR identification.
Figure 1. Clinical symptoms of diseased Pelodiscus sinensis. (A) Leaving the water body, the skin was congested (arrow). (B) Neck swelling (sign), eyelid swelling (asterisk). (C) Skin hyperemia (arrow), neck swelling (sign). (D) Redness of oral mucosa and gill-like tissue (triangle) (E) Enlarged liver(arrow). (F) kidney hemorrhage (triangle), ovarian hemorrhage(asterisk), bleeding from the external wall of the gastrointestinal tract (sign). (G)The spleen is hemorrhagic and enlarged (arrow).
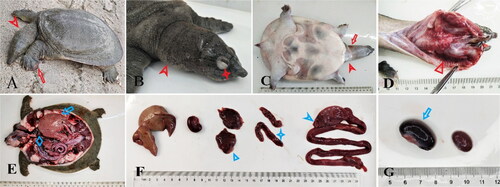
Figure 2. Morphological features of strain Y271. (A) Bacterial colony. (B) βhemolytic ring. (C) Gram staining (bar scale: 10 μm). (D) Scanning electron microscope (bar scale: 5 μm).
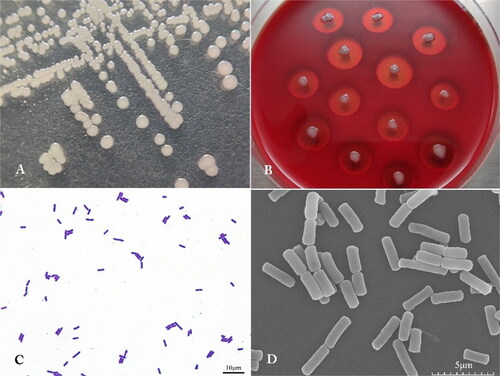
Figure 3. PCR identification of Bacillus cereus. (A) Phylogenetic tree of strain Y271 based on 16S rDNA gene. (B) Phylogenetic tree of strain Y271 based on gyrb gene. (C) M: 2000 marker; 1: Y271-1 2: Y271-2; 3: Y271-3; 4: Negative control. (D) Y271 toxin gene PCR assays. (E) The bacterial load in tissues of diseased P. sinensis caused by B. cereus. Brain 5.1 ± 0.8 × 101 copies/mg, liver 2.58 ± 0.29 × 10³ copies/mg, spleen 1.54 ± 0.12 × 10⁴ copies/mg, kidney 1.17 ± 0.18 × 10³ copies/mg, ovary 1.29 ± 0.04 × 10³ copies/mg, intestine 5.38 ± 0.42 × 10² copies/mg and blood 1.57 ± 0.19 × 10³ copies/mg.
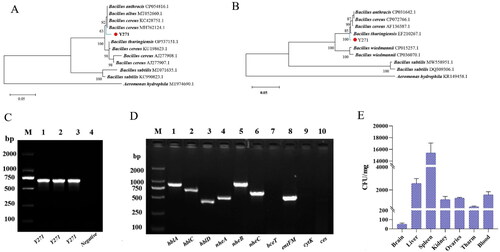
Table 2. Results of Biolog identification of strain Y271.
Figure 4. Percentage survival of P. sinensis attacked by different concentrations of Y271.
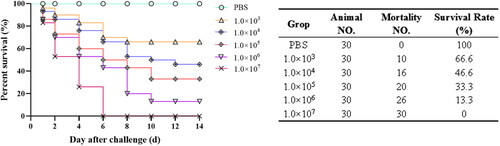
Figure 5. Histopathological observation of the healthy and diseased P. sinensis (scale bar: 50 μm and 10 μm). (A) a and b brain of a healthy P. sinensis, c, and brain of a diseased P. sinensis. (B) a and b eyes with healthy P. sinensis, c and d eyes with diseased P. sinensis. (C): a and b the eyelids of healthy P. sinensis, c, and d the eyelids of diseased P. sinensis. (D) a and b gill-like tissues of healthy P. sinensis, c and d gill-like tissues of diseased P. sinensis. (E) a and b spinal cords of healthy P. sinensis, c and d spinal cords of diseased P. sinensis. (F) a and b liver of healthy P. sinensis, c and d liver of diseased P. sinensis. (G) a and b spleen of healthy P. sinensis, c and d spleen of diseased P. sinensis. (H) a and b kidneys with healthy P. sinensis, c and d kidneys with diseased P. sinensis. (I) a and b ovarioles of healthy P. sinensis, c and d ovarioles of diseased P. sinensis. (J) a and b intestine of healthy P. sinensis, c and d intestine of diseased P. sinensis.
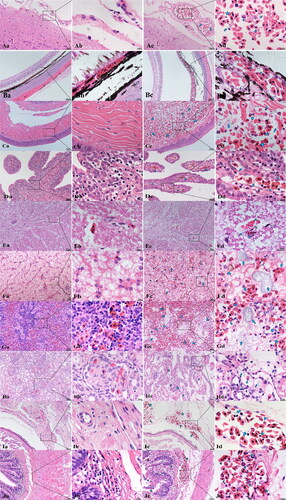
Figure 6. Gut microbiota analysis of P. sinensis. (A) Relative abundance of phylum levels. (B) Relative abundance of genus levels. (C) The Venn diagram showing the number of unique and shared operational taxonomic units (OTUs) of gut bacteria of healthy and diseased P. sinensis. (healthy P. sinensis: C; diseased P. sinensis: D).
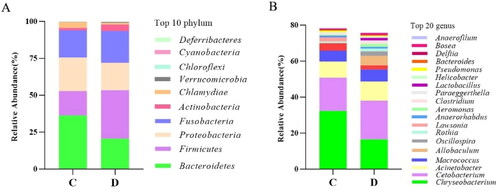
Table 3. Results of antibiotic sensitivity test for strain Y271.