
Figures & data
Table 1. Detailed information of the obtained GyVg1 stains.
Figure 1. Analysis of the evolution and identity of genome nt sequences. (a) The GyVg1 strains developed in this study and other reference strains are shown using a heat map with the results of their full genome similarity analysis displayed on the lower left (various identity values are expressed in gradient colors ranging from 88% to 100%). (b) in the evolutionary tree for the genome, the canine strains are marked with red pentagrams, feline strains with red squares, canine reference strains with blue pentagrams, and feline hosts with blue squares.
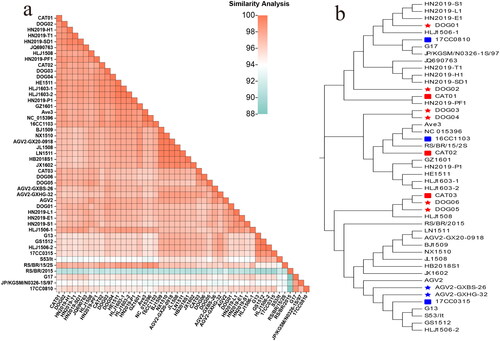
Figure 2. Analysis of the evolution and identity of the VP1 aa sequences. (a) Heat map showing the similarity analysis between the GyVg1 strains acquired in this study and other reference strains. The gradient colors on the lower left indicate different identity values ranging from 80% to 100%. (b) In the VP1 evolutionary tree, the canine strains are identified with red pentagrams, feline strains with red squares, canine hosts in the reference strains with blue pentagrams, and feline hosts with blue squares.
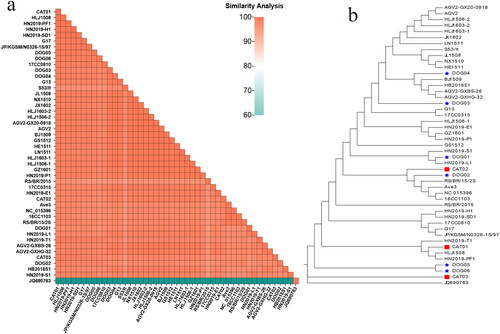
Figure 3. Analysis of the evolution and identity of the UTR nt sequences. (a) Heat map showing the comparison of similarity between the UTRs of the GyVg1 strains used in this study and other reference strains (bottom left: levels of identity are shown by gradient colors ranging from 40% to 100%).(b) in the evolutionary tree, the canine strains are marked with red pentagrams, feline strains with red squares, canine reference strains with blue pentagrams, and feline hosts with blue squares.
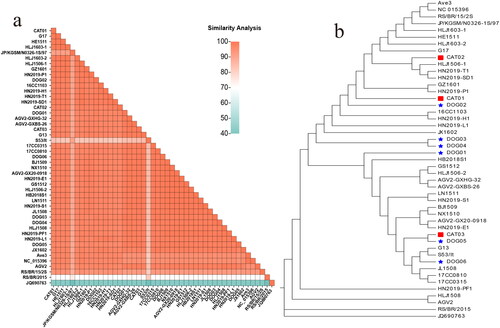
Figure 4. Recombination occurrence in CAT03, DOG06, CAT02, DOG05, DOG01, and CAT01 strains was predicted using simplot software. (a) Recombination event related to CAT03. (b) Recombination event related to DOG06. (c) Recombination event related to CAT02. (d) Recombination event related to DOG05. (e) Recombination event related to DOG06. (f) Recombination event related to CAT01.
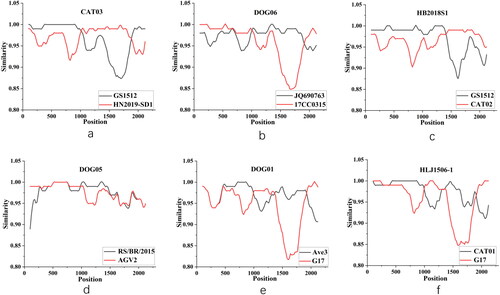
Table 2. Recombinant events predicted using different algorithms.
Supplemental Material
Download MS Word (53.1 KB)Data availability statement
All data generated or analyzed during this study are included in this article.