
Figures & data
Table 1. Hematological and thromboelastography findings on the day of surgery and 2, 7, and 14 days after splenectomy.
Figure 1. Box-and-Whisker plots of platelet counts on the day of surgery (day 0) and 2, 7, and 14 days after splenectomy in groups A (A) and B (B). The boxes indicate the interquartile ranges (25th–75th percentile), and lines within the boxes indicate the median values. Whiskers indicate either 1.5 times the interquartile range or the range limit for the data, whichever is less. The light blue horizontal band within each plot indicates the reference range. Asterisks indicate days when platelet counts were significantly different (p < 0.05) from that of day 0.
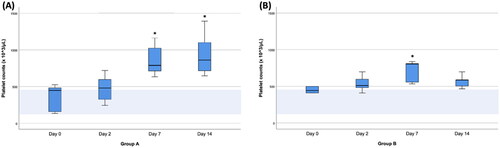
Figure 2. Box-and-Whisker plots of thromboelastography parameters (A; K value, B; α-angle value, C; maximum amplitude [MA], D; G value) on the day of surgery (day 0) and 2, 7, and 14 days after splenectomy in group B. The boxes indicate the interquartile ranges (25th–75th percentile), and lines within the boxes indicate median values. Whiskers indicate either 1.5 times the interquartile range or the range limit for the data, whichever is less. The light blue horizontal band within each plot indicates the reference range. Asterisks indicate days when values for the thromboelastography parameters were significantly different (p < 0.05) from those of day 0.
![Figure 2. Box-and-Whisker plots of thromboelastography parameters (A; K value, B; α-angle value, C; maximum amplitude [MA], D; G value) on the day of surgery (day 0) and 2, 7, and 14 days after splenectomy in group B. The boxes indicate the interquartile ranges (25th–75th percentile), and lines within the boxes indicate median values. Whiskers indicate either 1.5 times the interquartile range or the range limit for the data, whichever is less. The light blue horizontal band within each plot indicates the reference range. Asterisks indicate days when values for the thromboelastography parameters were significantly different (p < 0.05) from those of day 0.](/cms/asset/ed5671f2-4108-4af5-b63d-c855f1df586e/tveq_a_2347926_f0002_c.jpg)
Figure 3. Scatterplot showing the relationship between platelet counts and thromboelastography parameters (A; K value, B; α-angle value, C; maximum amplitude [MA], D; G value) for 14 days in group B. The correlation (r) and associated statistical significance (P-value) are displayed at the top of each graph.
![Figure 3. Scatterplot showing the relationship between platelet counts and thromboelastography parameters (A; K value, B; α-angle value, C; maximum amplitude [MA], D; G value) for 14 days in group B. The correlation (r) and associated statistical significance (P-value) are displayed at the top of each graph.](/cms/asset/5e5d13eb-2f31-47e5-b3e4-2ff21748ba55/tveq_a_2347926_f0003_b.jpg)
Data availability statement
The original contributions presented in the study are included in the article/supplementary material, further inquiries can be directed to the corresponding author.