
Figures & data
Figure 1. Schematic illustration of the present study design.
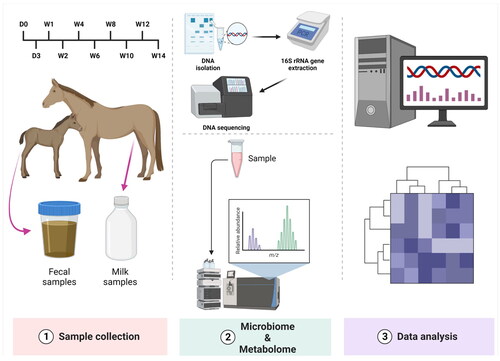
Figure 2. Relative abundance of bacterial phylum association with the mother (left side) and the foals (right side) during the lactation period (from day 3 to week 14 after birth).
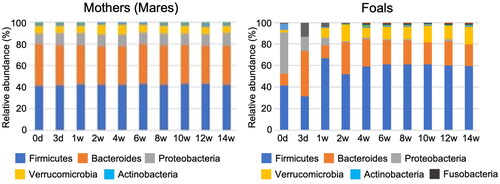
Figure 3. Alpha-diversity, measured by Chao1 and Shannon index is plotted for the mother (left side) and foals (right side) during the lactation period (from day 3 to week 14 after birth).
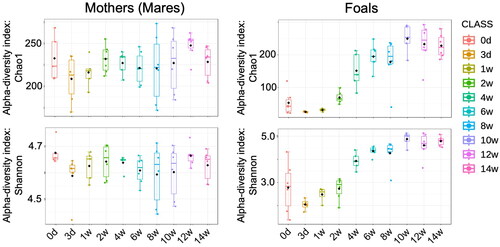
Figure 4. Plots of PCoA based on the the unweighted UniFrac distance index and permutational multivariate analysis of variance (p < 0.05) during the lactation period (from day 3 to week 14 after birth).
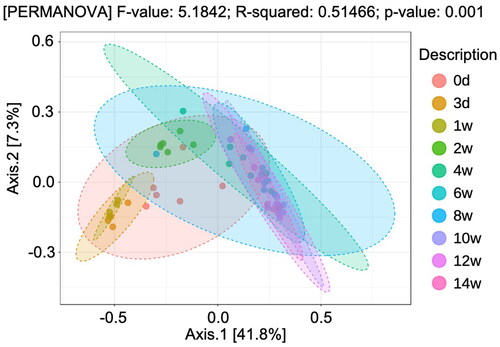
Figure 5. Dendrogram constructed with foals’ gut microbiome over experimental period by ward methods, based on the Unweighted UniFrac Distance index.
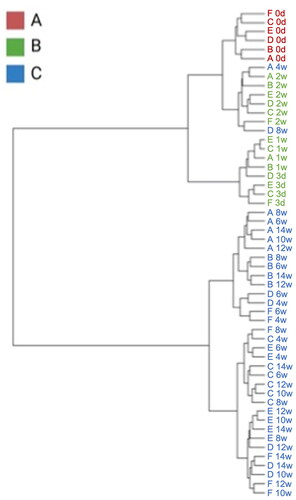
Figure 6. Composition of the foals’ gut microbiome at different time points. Linear discriminant analysis effect size (LEfSe analysis) at the family level (A) and changes in the abundance of each bacterium (B).
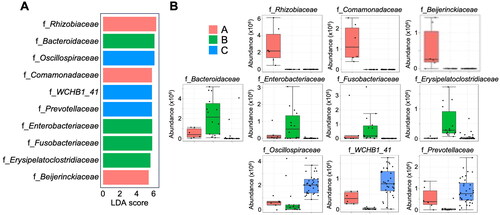
Figure 7. Variations in the metabolic components of the breast milk samples from the mares. A: 2D principal component analysis score plot of group A, group B, and group C. B: Important features identified by partial least-squares discriminant analysis among group A, group B, and group C. C: Important features identified by partial least-squares discriminant analysis among group B and group C. The colored boxes on the right indicate the relative concentrations of the corresponding metabolites in each group.
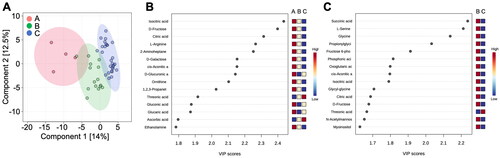
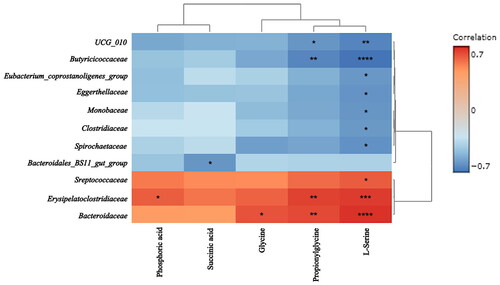
Figure 8. Heat map showing the correlation between the metabolome of the breast milk of mares and the development of the gut microbiome of foals. *p < 0.05, **p < 0.01, ***p < 0.001, and ****p < 0.0001.
Data availability statement
The datasets displayed in the present investigation can be found in online repositories. The repository/repositories’ names and the accession number(s) can be attained below: https://www.ncbi.nlm.nih.gov/genbank/, PRJNA1006090.