
Figures & data
Table 1. Differences in bone length (cm) among three breeds of growing-finishing pigs.
Table 2. Differences in bone weight (g) among different breeds of growing-finishing pigs.
Table 3. Differences in bone index (g/kg) among different breeds of growing-finishing pigs.
Table 4. Differences in bone mineral density (g/cm3) among different breeds of growing-finishing pigs.
Table 5. Differences in bone mineral content (g) among different breeds of growing-finishing pigs.
Table 6. Differences in bone breaking load (N) among different breeds of growing-finishing pigs.
Figure 1. Differences in bone ash content among three breeds of growing-finishing pigs. Values are shown as means with their SEM. The replicates at 80, 125, and 185 D were six pigs per breed. Different small letters (a, b, and c) indicate significant differences among different pig breeds at the same day-old (p < 0.05). 80, 125, and 185 D, represent 80, 125, and 185 day-old, respectively.
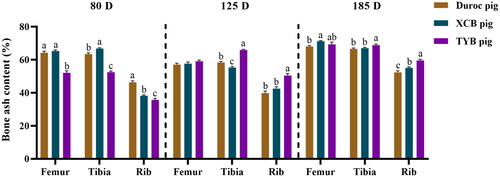
Figure 2. Differences in serum concentrations of osteogenesis factors (A–D) and bone resorption markers (E–F) among three breeds of growing-finishing pigs. Different small letters (a and b) indicate significant differences among different pig breeds at the same day-old (p < 0.05). 80, 125, and 185 D, represent 80, 125, and 185 day-old, respectively.
BMP-2 = bone morphogenetic protein-2; BALP = bone alkaline phosphatase; OC = osteocalcin; PINP = procollagen I N-terminal propeptide; TRACP 5b = tartrate-resistant acid phosphatase 5b; CTX-1 = type I collagen carboxy-terminal peptide. The replicates of Duroc, XCB, and TYB pigs at 80 D were 9, 9, and 10, respectively. The replicates of Duroc, XCB, and TYB pigs at 125 D were 9, 9, and 8, respectively. The replicates of Duroc, XCB, and TYB pigs at 185 D were 9, 10, and 9, respectively.
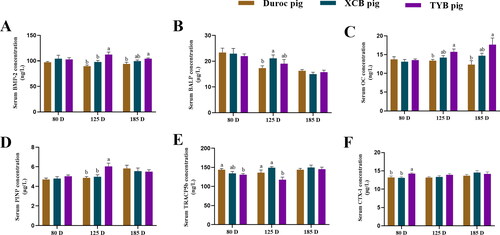
Table 7. Differences in the ATTD (%) of Ca and P among different breeds of growing-finishing pigs.
Table 8. Differences in serum Ca and P concentrations (mmol/L) among different breeds of growing-finishing pigs.
Figure 3. Differences in bone Ca (A) and P (B) contents among three breeds of growing-finishing pigs. The replicates at 80, 125, and 185 D were six per breed. Different small letters (a and b) indicate significant differences among different pig breeds at the same day-old (p < 0.05). 80, 125, and 185 D, represent 80, 125, and 185 day-old, respectively.
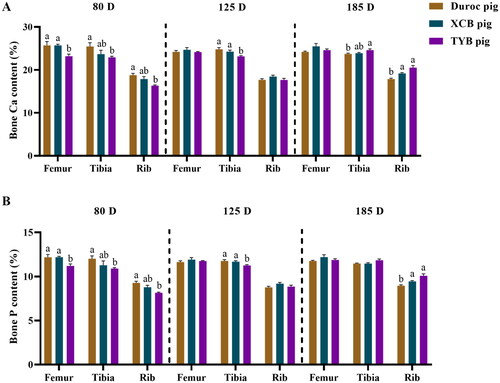
Figure 4. Differences in serum indicators related to Ca (A–C) and P (D–E) metabolism among three breeds of growing-finishing pigs. Different small letters (a and b) indicate significant differences among different pig breeds at the same day-old (p < 0.05). The replicates of duroc, XCB, and TYB pigs at 80 D were 9, 9, and 10, respectively. The replicates of duroc, XCB, and TYB pigs at 125 D were 9, 9, and 8, respectively. The replicates of duroc, XCB, and TYB pigs at 185 D were 9, 10, and 9, respectively. 80, 125, and 185 D represent 80, 125, and 185 day-old, respectively.
CT = calcitonin; PTH = parathyroid hormone; T4 = thyroxine; FGF23 = fibroblast growth factor 23.
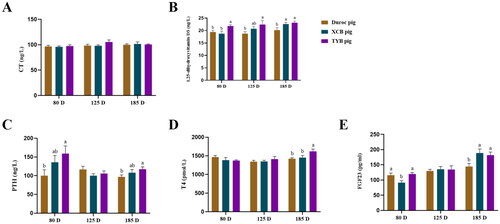
Figure 5. Differences in mRNA expressions of Ca and P transporters in the kidney (a), duodenum (B), jejunum (C), and ileum (D) of three different breeds of pigs at 80 day-old (D). The replicates were eight pigs per breed. Different small letters (a, b and c) indicate significant differences among different pig breeds (p < 0.05).
Napi-IIa = sodium-dependent phosphate transport protein 2a; Napi-IIb = sodium-dependent phosphate transport protein 2b; S100G = S100 calcium binding protein G; PMCA1 = plasma membrane calcium-transporting ATPase 1; SLC8A1 = solute carrier family 8 member 1; TRPV5 = transient receptor potential cation channel, subfamily V, member 5; TRPV6 = transient receptor potential cation channel, subfamily V, member 6; CALB1 = calbindin 1; VDR = vitamin D receptor.
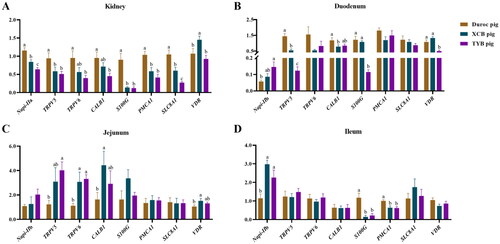
Figure 6. Differences in mRNA expressions of Ca and P transporters in the kidney (a), duodenum (B), jejunum (C), and ileum (D) of three different breeds of pigs at 125 day-old (D). The replicates were eight pigs per breed. Different small letters (a and b) indicate significant differences among different pig breeds (p < 0.05).
Napi-IIa = sodium-dependent phosphate transport protein 2a; Napi-IIb = sodium-dependent phosphate transport protein 2b; S100G = S100 calcium binding protein G; PMCA1 = plasma membrane calcium-transporting ATPase 1; SLC8A1 = solute carrier family 8 member 1; TRPV5 = transient receptor potential cation channel, subfamily V, member 5; TRPV6 = transient receptor potential cation channel, subfamily V, member 6; CALB1 = calbindin 1; VDR = vitamin D receptor.
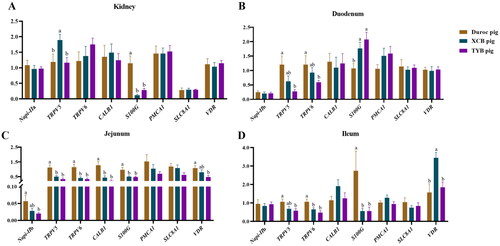
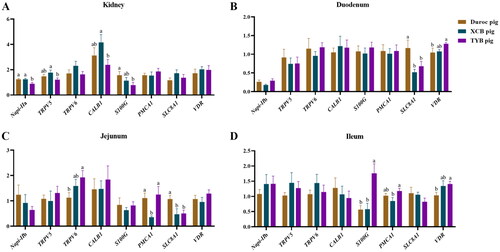
Figure 7. Differences in mRNA expressions of Ca and P transporters in the kidney (a), duodenum (B), jejunum (C), and ileum (D) of three different breeds of pigs at 185 day-old (D). The replicates were eight pigs per breed. Different small letters (a and b) indicate significant differences among different pig breeds.
Napi-IIa = sodium-dependent phosphate transport protein 2a; Napi-IIb = sodium-dependent phosphate transport protein 2b; S100G = S100 calcium binding protein G; PMCA1 = plasma membrane calcium-transporting ATPase 1; SLC8A1 = solute carrier family 8 member 1; TRPV5 = transient receptor potential cation channel, subfamily V, member 5; TRPV6 = transient receptor potential cation channel, subfamily V, member 6; CALB1 = calbindin 1; VDR = vitamin D receptor.
Supplemental Material
Download MS Word (22.1 KB)Data availability statement
The original contributions presented in the study are included in the article [and/or] its supplementary materials.