1,912
Views
3
CrossRef citations to date
0
Altmetric
Original Articles

Relative Afferent Pupillary Defects in Homonymous Visual Field Defects Caused by Stroke of the Occipital Lobe Using Pupillometer

, , , , , , , & show all
Pages 139-145 | Received 30 Apr 2017, Accepted 09 Aug 2017, Published online: 31 Aug 2017

Figures & data

Table 1. Detailed profile and results of patients with HVFDs.

Table 2. The clinical characteristics of the 15 patients with HVFDs.

Figure 1. Box plot of the relative afferent pupillary defect (RAPD) scores in the patients with homonymous visual field defects (HVFD) and control groups. Upper horizontal line of box = mean plus one standard deviation (SD); Lower horizontal line of box = mean minus one SD; horizontal bar within box = mean; Upper horizontal bar outside box = maximum; Lower horizontal bar outside box = minimum. Circle = each measured value. RAPD scores of amplitude of the HVFDs (the sign of scores of the patients with left HVFDs were inverted to merge the data, n = 15) group were significantly higher in the eye contralateral to the brain lesion than those in the control group (n = 32) (< 0.05). Also, the RAPD scores of latency were significantly higher in the eye contralateral to the brain lesion than those of the controls (p < 0.01). * p < 0.05, ** p < 0.01.
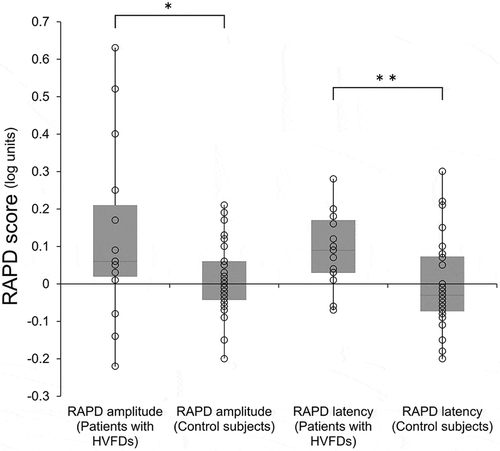
Figure 1. Box plot of the relative afferent pupillary defect (RAPD) scores in the patients with homonymous visual field defects (HVFD) and control groups. Upper horizontal line of box = mean plus one standard deviation (SD); Lower horizontal line of box = mean minus one SD; horizontal bar within box = mean; Upper horizontal bar outside box = maximum; Lower horizontal bar outside box = minimum. Circle = each measured value. RAPD scores of amplitude of the HVFDs (the sign of scores of the patients with left HVFDs were inverted to merge the data, n = 15) group were significantly higher in the eye contralateral to the brain lesion than those in the control group (n = 32) (p < 0.05). Also, the RAPD scores of latency were significantly higher in the eye contralateral to the brain lesion than those of the controls (p < 0.01). * p < 0.05, ** p < 0.01.

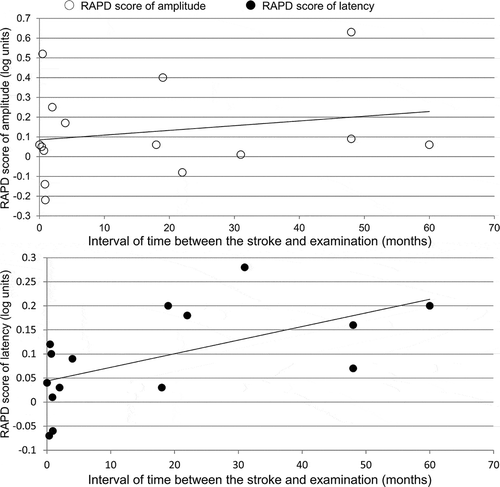
Figure 2. The relationship between the RAPD scores and the interval of time from the stroke to examination of RAPD.

The upper scatter plot shows the relationship between the RAPD score of amplitude (the sign of scores of the patients with left HVFDs was inverted to merge them with those of the right HVFDs, n = 15) and interval of time from the stroke to examination. R = 0.21 (p = 0.45). The lower scatter plot shows the relationship between the RAPD score of latency (the sign of scores of the patients with left HVFDs was inverted to merge them with those of the right HVFDs, n = 15) and interval of time from the stroke to examination. R = 0.59 (= 0.02).

Figure 2. The relationship between the RAPD scores and the interval of time from the stroke to examination of RAPD.The upper scatter plot shows the relationship between the RAPD score of amplitude (the sign of scores of the patients with left HVFDs was inverted to merge them with those of the right HVFDs, n = 15) and interval of time from the stroke to examination. R = 0.21 (p = 0.45). The lower scatter plot shows the relationship between the RAPD score of latency (the sign of scores of the patients with left HVFDs was inverted to merge them with those of the right HVFDs, n = 15) and interval of time from the stroke to examination. R = 0.59 (p = 0.02).