Figures & data
Figure 1. Optical coherence tomography (OCT) infrared images of the optic nerves at presentation: (a) right eye; (b) left eye, both showing papilloedema. OCT infra-red images at 2 months, following treatment: (c) right eye; (d) left eye, both without papilloedema.
Figure 2. Optical coherence tomography retinal nerve fibre layer thickness (RNFL) at presentation showing increased thicknesses of the RNFL: (a) right eye and (b) left eye.
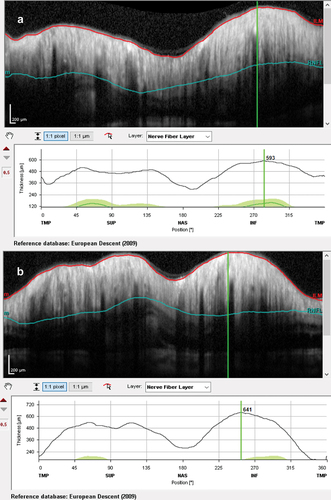
Figure 3. Computed tomography scans (upper row) and magnetic resonance imaging (lower row) showing a partially empty sella turcica and small ventricles, suggestive of intracranial hypertension.
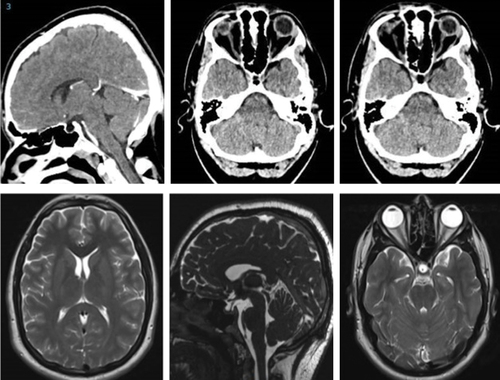
Figure 4. Goldmann visual fields in the (a) Left eye and (b) Right eye at 2 months, following treatment.
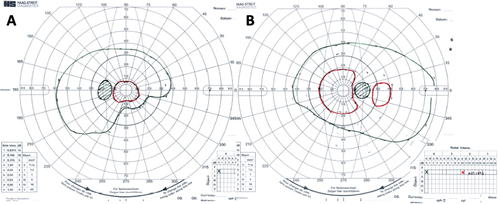
Figure 5. Optical coherence tomography retinal nerve fibre layer thicknesses at 2 months, following treatment: (a) right eye and (b) left eye.
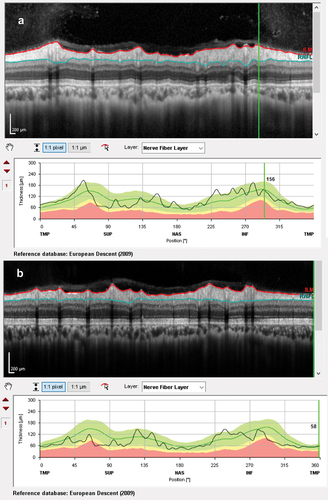
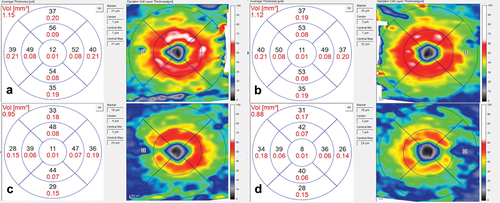
Figure 6. Optical coherence tomography macular ganglion cell analysis: (a) right eye at presentation; (b) left eye at presentation; (c) right eye at 2 months, following treatment and; (d) left eye at 2 months, following treatment.