
Figures & data
Figure 1. Flowchart and design of the study. *for this variable n = 492 as 29 reports could be added from medical files.
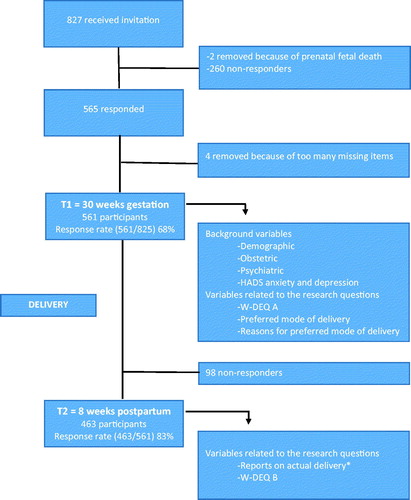
Table 1. Demographic, obstetric and psychological variables reported at T1 (30 weeks of pregnancy) in relation to preferred mode of delivery (total n: between 534 and 561).
Table 2. W-DEQ scores in nulliparous and parous women at T1 (30 weeks of gestation, n = 492) and T2 (8 weeks postpartum, n = 455) distributed over four PAC groups, subdivided according to parity and previous obstetric history.
Table 3. Logistic regression for variables predicting preferred mode of delivery (VD or CS) (χ2 = 100.7, df = 5, p < .001, Nagelkerke R2 = 0.36).
Table 4. Three block hierarchical multiple regression analysis for variables predicting W-DEQ score postpartum (F(9,445) = 20.3, p < .001, adjusted R2 = 0.28).